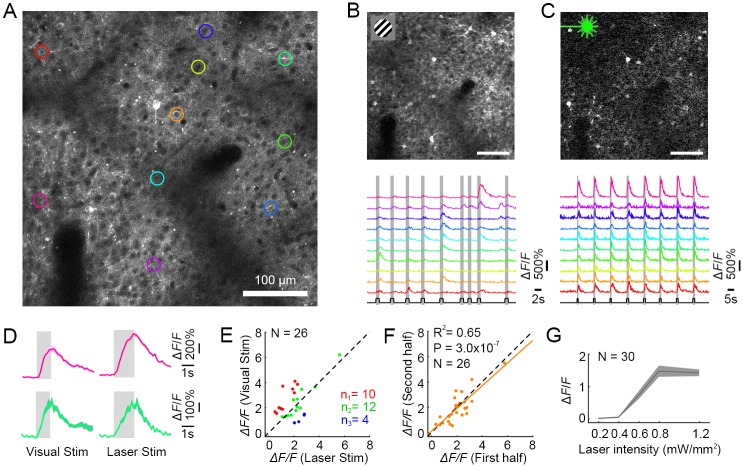
Fig 1. AOI of a V1 neuronal population in awake macaque.
(A) 2P image of V1 neurons expressing C1V1–ts–EYFP and GCaMP6s. The colored regions of interest (ROIs) indicate neurons that responded to both visual and optical stimuli, targeted for further analysis. (B) Top, a differential image of GCaMP6s fluorescence (stimulated-baseline [F-F0], averaged across all stimulations), driven by visual stimuli consisting of gratings or colored patches. Bottom, calcium signals from 10 neurons (colors from panel A) in response to 9 varied visual stimuli (presentation times in gray). (C) Top, widefield optogenetic stimulation (0.8 mW/mm2, 30 Hz and 25% duty ratio) evoked robust responses in the same neurons. Bottom, 8 sequential identical optogenetic stimulations evoked equivalent responses in each cycle. (D) Responses of two neurons to their preferred visual stimuli (Left pink cell, color patch response; Left green cell, drifting grating response; mean ± s.e.m., n = 10 trials) versus photostimulation in the same cells (Right, mean ± s.e.m., n = 9 trials). (E) Neuronal population responses (N = 26) to their preferred visual stimuli versus laser stimulation. Green dots stand for cells that have similar responses to visual versus laser stimuli (p > 0.05), red dots for cells that have significantly stronger responses to visual stimuli versus laser stimulation (p < 0.05), and blue dots vice versa (p < 0.05). (F) Neuronal population responses (N = 26) from the first versus last four trials from a single experiment. (G) Laser intensity dose-response curve (mean ± s.e.m., n = 9 trials, N = 30 neurons). Optogenetic stimulation saturates at approximately 0.8 mW/mm2. Data can be found at https://github.com/EastRainju/Opto-TP. See also S2 Fig. 1P, single-photon; 2P, two-photon; AOI, all-optical interrogation; C1V1, ChR1/VChR1; GCaMP, genetically encoded calmodulin protein; ROI, region of interest.

