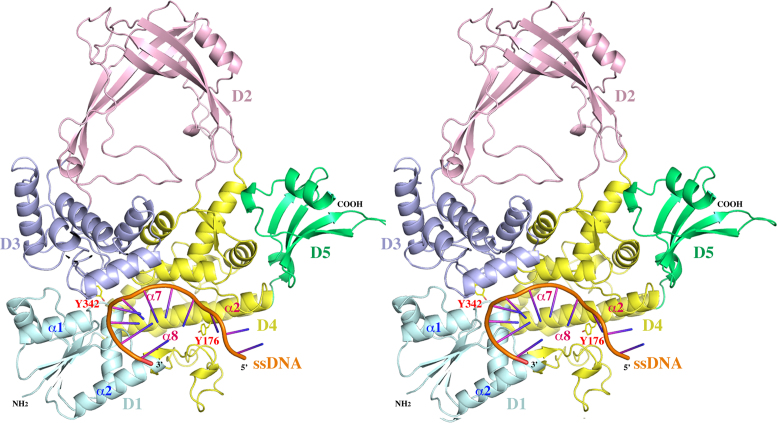
Figure 1.
A stereoview of a ribbon diagram of the structure of MtbTOP1-704t/ssDNA complex. The five individual domains, D1–D5, are colored in cyan, pink, blue, yellow and green, respectively. The phosphate backbone of the oligonucleotide substrate is in orange with its polarity labeled. The catalytic residue Y342 is drawn in stick format to highlight its active site position. Y176 is drawn to indicate the relative position between Y342 and the C nucleotide binding pocket (Figure 2B) four bases upstream of scissile phosphate. Only a few secondary structures are labeled for the purpose of discussion. The numberings of these secondary structures are based on individual domains. The conformational changes induced by ssDNA binding can be viewed in SI movies 1 and 2. The program Pymol was used for the preparation of Figures 1–4.

