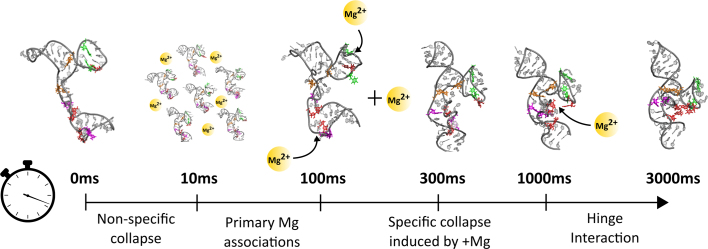
Figure 7.
Summary of the distinct phases of collapse observed on the route to the native state. The key phases of collapse are named and illustrated, along with a cartoon representation of the inferred Mg associations triggering each phase. Mg ions are schematically depicted as orange spheres; arrows suggest their suspected interaction regions with RNA.

