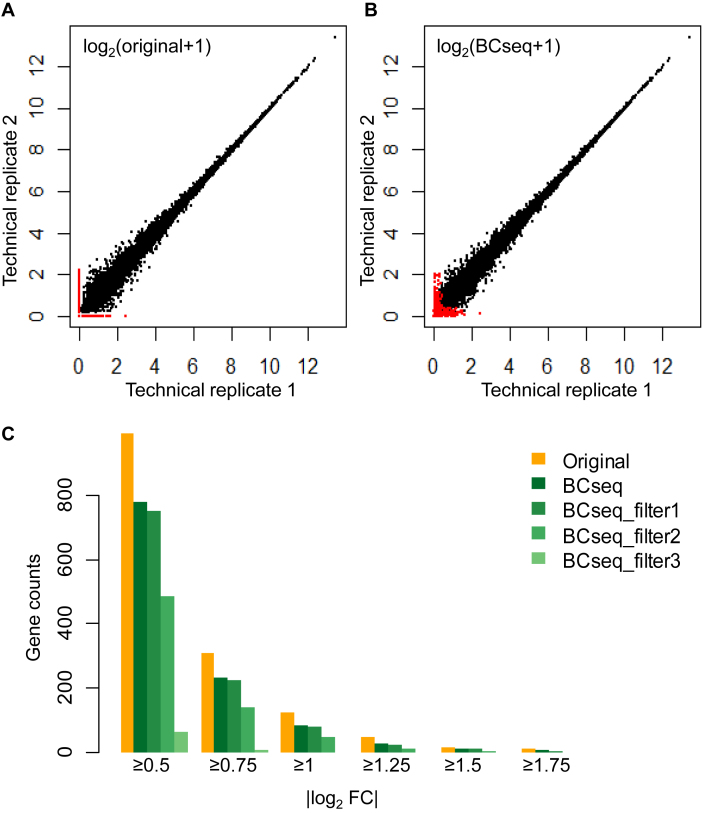
Figure 2.
BCseq improves the consistency between two scRNA-seq technical replicates from the same cell. Comparison of the two technical replicates by (A) original STAR-derived TPM measures and (B) BCseq measures. Red dots represent dropouts that show high expression in one sample but zero expression in the other according to TPM measures. (C) Counts of genes with specified fold change (FC). The fold change is the TMP+1 or BCseq+1 ratio between two replicates. Different filters based on the BCseq quality measures were applied. The three filters are assigned according to the first quartile, the median, and the third quartile of all quality scores. Filter 1: consider genes with quality scores larger than −33.2 (i.e. first quartile of the quality scores) in both samples. Filter 2: consider genes with quality scores larger than −0.2 (i.e. median of the quality scores) in both samples. Filter 3: consider genes with quality scores larger than 1.5 (i.e. third quartile of the quality scores) in both samples.

