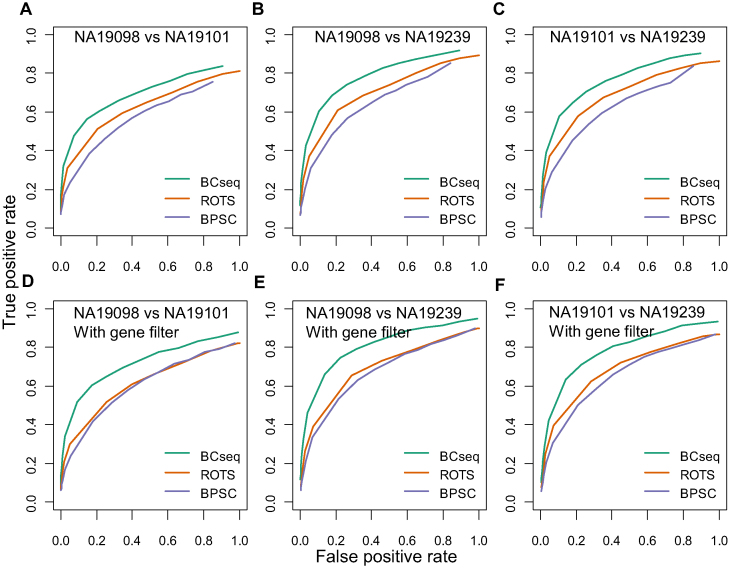
Figure 5.
Comparison of BCseq, ROTS and BPSC in DE analysis between different cell lines. ROC curves were based on ‘gold standards’ identified from bulk RNA-seq data. Each cell line (NA19098, NA19101, and NA19239) contains three bulk RNA-seq replicates with large sequencing depth. T-tests of DE genes were performed for each cell line pair. Genes with a P-value ≤ 0.01 are treated as true positives and genes with a P-value > 0.1 are treated as true negatives. DE analysis of scRNA-seq was performed by BCseq, ROTS, and BPSC, respectively. Each cell line contains 288 scRNA-seq. (A–C) all genes were considered. (D–F) only genes with average TPM measures across the three bulk RNA-seq replicates ≥1 for both cell lines were considered.

