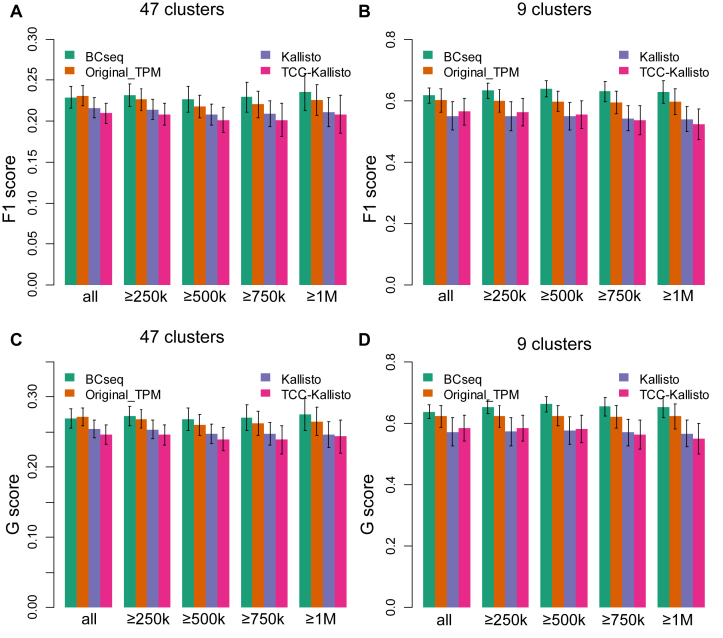
Figure 7.
Evaluation of clustering performance. One third of cells were randomly selected each time and the spectral clustering was repeated 50 times. Spectral clustering was performed on the sampled cells with (A, C) 47 centers or (B, D) nine centers. F1 score (A and B) and G score (C and D) were calculated based on the precision and recall values. We counted each cell pair as true positive (tp) or false positive (fp) based on whether they were correctly clustered together. We also counted true negatives (tn) and false negatives (fn) based on whether a cell pair was correctly assigned to different clusters. Precision is calculated as  . Recall is calculated as
  . Then
  and
and  . Five scenarios of cell inclusion for F1 and G score calculation are presented: all selected cell pairs (‘all’), cell pairs with more than 250k, 500k, 750k and 1M mapped reads per cell. The mean and standard deviation of F1 and G scores are shown.

