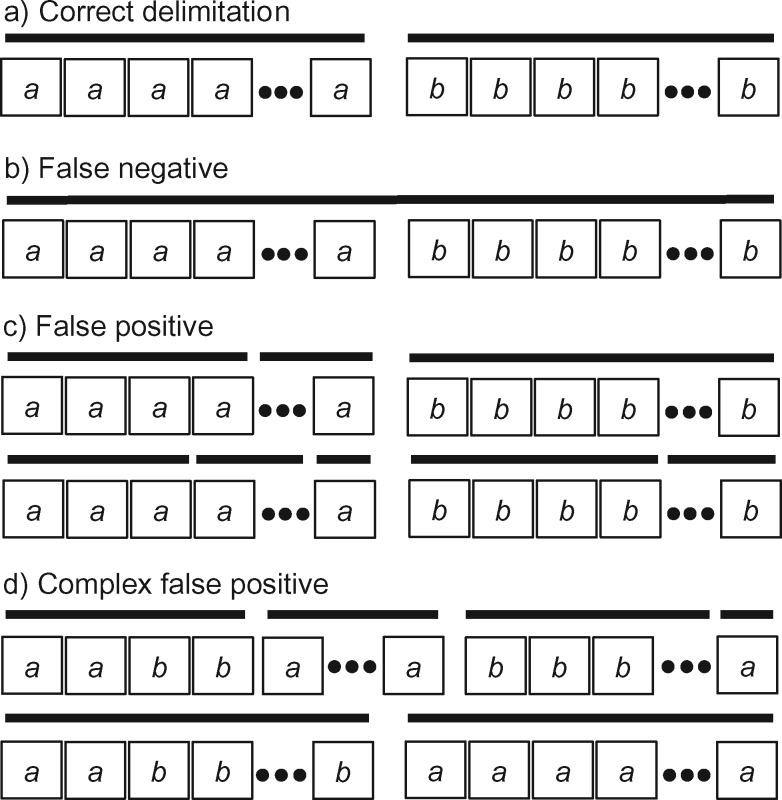
Figure 2.
An illustration of four categories used to classify the results of our species delimitations, for every species pair, by the GMYC and the PTP methods. Boxes with  and
and  represent individuals of simulated species A and B, respectively, with additional individuals implied by the ellipses. Black bars above the boxes denote delimitation results; each bar indicates an OTU. Two illustrative examples each are given for false positives and for complex false positives.

