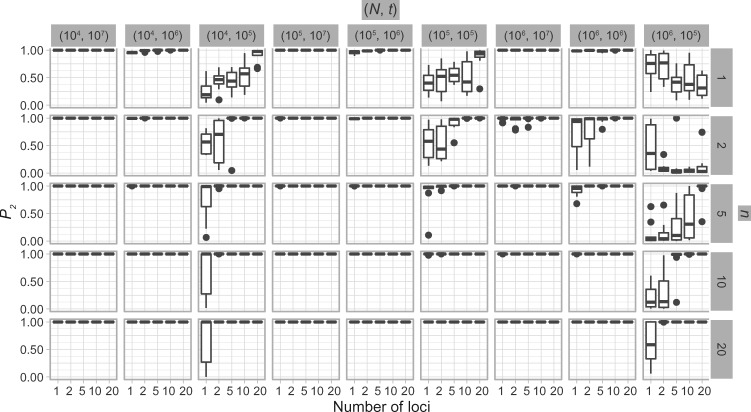
Figure 3.
Species delimitations estimated by the Bayesian coalescent method in BPP. Boxplots are shown for posterior probabilities of the two-species delimitation model ( , across every 10 replicates under each set of conditions for Scenario II. Nine combinations (
 ,
,  of population size
  and divergence time
  are shown along the top, together with five values of sample size
  on the right. The
  -axis represents the number of loci, while probabilities are given on the
  -axis.

