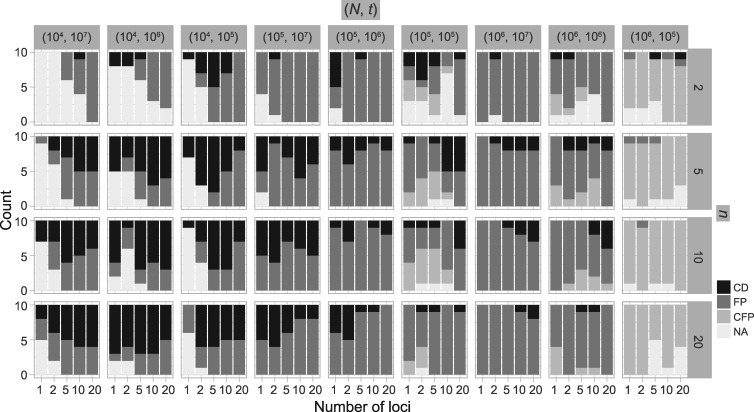
Figure 4.
Species delimitations estimated by GMYC for datasets from Scenario II. Panels show nine combinations of population size  and divergence time
  along the top, and four values of sample size
  on the right. The
  -axis represents the number of loci. The
  -axis represents the number of cases classified by correct delimitation (CD), false positive (FP), complex false positive (CFP), and not available (NA) among the 10 replicates under each set of conditions, which are denoted by different shades according to the legend in the bottom-right. No false negatives occurred in the results from Scenario II.

