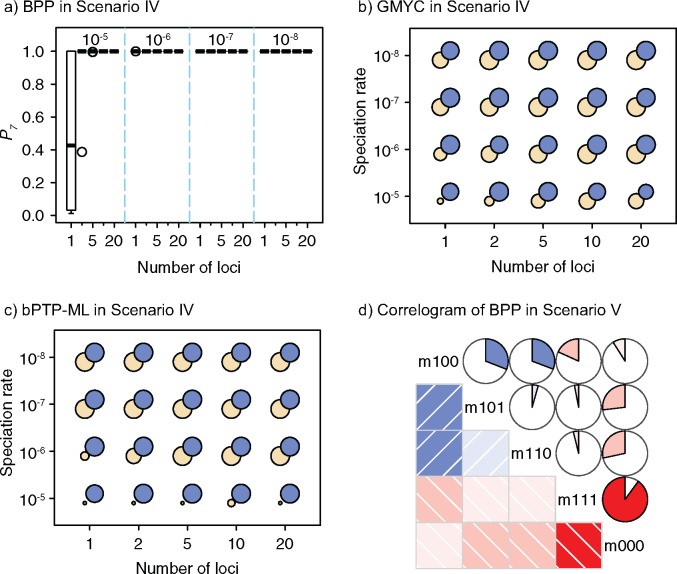
Figure 6.
a) Posterior probabilities of the correct species delimitation model 1111 ( by BPP in Scenario IV. Probabilities are along the
  -axis for every 10 replicates of each number of loci (
 -axis) combined with the speciation rates (indicated by text above the boxplots). b) Symbol plots of correct delimitations by GMYC in Scenario IV. Yellow (light grey in printed version) circles represent results from the four species pairs along the two basal branches, while blue (dark grey in printed version) circles represent results from the six species pairs across the two basal branches. Relative areas of circles correspond to the percentages of correct delimitations in the respective full delimitations (Supplementary Appendix S12 available on Dryad), with the maximum area indicating 100%. Symbols in (c) have the same meaning as in (b), but show correct delimitations by bPTP-ML in Scenario IV. (d) Correlogram of posterior probabilities inferred by BPP across 250 datasets in Scenario V. Diagonal lines running from top-left to bottom-right in the red panels below the diagonal and red pies above the diagonal denote negative correlation, whereas diagonal lines running from bottom-left to top-right in the blue panels below the diagonal and blue pies above the diagonal denote positive correlation (the blue and red colors are only shown in online version). Darker colors indicate stronger relationships. Delimitation models are denoted by the character “m” and numbers along the diagonal, such as “m111” for delimitation model 111.

