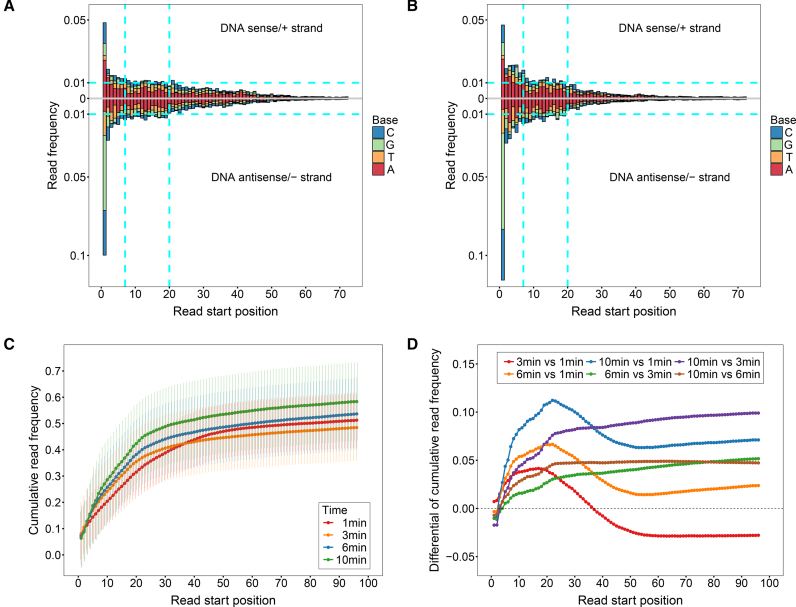
Figure 2.
Read frequency as a function of read start position and overall digestion profile as a function of time. Read frequencies of the 20 +1 nucleosomes as a function of read start position for the 1-min and 3-min assays are shown in (A) and (B), respectively. The 5′ terminal nucleotides of both DNA strands are indexed from ‘0’. Read frequencies of the DNA sense/+ and antisense/− strands are shown in the upper and lower panels in the figures, respectively. DNA base compositions for each read start position are also indicated. (C) Cumulative read frequency as a function of read start position at different incubation times. Cumulative read frequencies were calculated from position 1 (instead of 0), averaged over the 40 strands of the 20 +1 nucleosomes. (D) Differentials of cumulative read frequencies between incubation times are shown.

