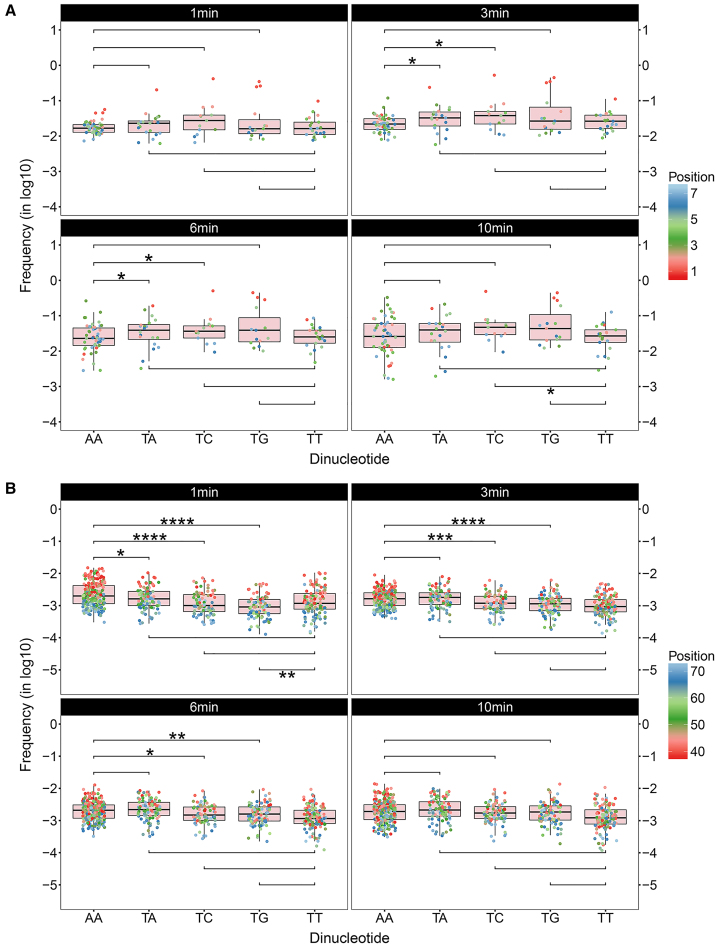
Figure 5.
Frequencies of dinucleotide cleavage at the end and internal regions. (A) Cut frequencies of dinucleotides AA, TA, TC, TG and TT at the end region are shown in boxplots for different incubation times. The end region was defined from dinucleotide position 1 to 7 and the frequencies were transformed in the log10 scale. One-sided Mann–Whitney U-tests were carried out to compare the digestions at the end region between AA/TT and TX (X = A, C, G) at a significance level of 0.05. The alternative hypotheses were defined as H1: AA < TX and H1: TT < TX, respectively. If the one-sided P-value is lower than 0.05, the null hypothesis is rejected in favour of the alternative hypothesis. The symbolic indications of statistical significance are as follows: (i) *: P-value ≤ 0.05; (ii) **: P-value ≤ 0.01; (iii) ***: P-value ≤ 0.001; (iv) ****: P-value ≤ 0.0001 (same below). (B) Cut frequencies of dinucleotides AA, TA, TC, TG and TT at the internal region are shown in boxplots for different incubation times. The internal region was defined from dinucleotide position 38 to 73 and the frequencies were transformed in the log10 scale. One-sided Mann–Whitney U-tests were carried out to compare the digestions at the internal region between AA/TT and TX (X = A, C, G) at a significance level of 0.05. The alternative hypotheses were defined as H1: AA > TX and H1: TT > TX, respectively. Here, the alternative hypotheses were reversed from those defined for the end region so that the expected decisions are always indicated by P-value ≤ 0.05.

