Figure 3.
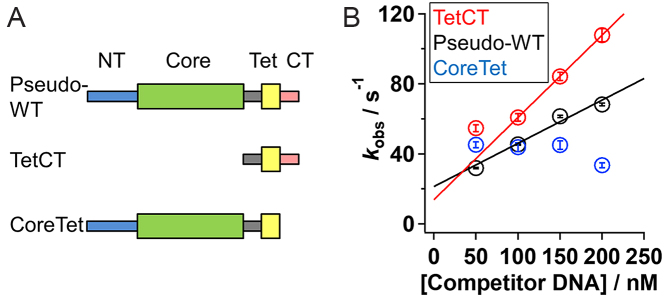
Ensemble kinetic observation of IST for the p53 mutants. (A) Domain organization of the p53 mutants. The pseudo-WT p53 is composed of the NT, core, linker, Tet and CT domains. Thick and thin rectangles represent the structured domain and disordered domain, respectively. (B) The apparent dissociation rate constants (kobs) of the pseudo-WT (black), TetCT (red), and CoreTet (blue) mutants of p53 from the non-target 30 bp DNA in the presence of 50 mM K+ and 1 mM Mg2+ plotted against the competitor DNA concentration. The error bars represent fitting errors of kinetic anisotropy changes using an exponential function. The data in the presence of 50 nM of competitor DNA were obtained in the condition that did not satisfy the pseudo first order approximation, and were presented for comparison. The lines show a linear-fitting of the results obtained in the competitor concentrations between 100 and 200 nM, whose slope corresponds to kIST.

