Figure 5.
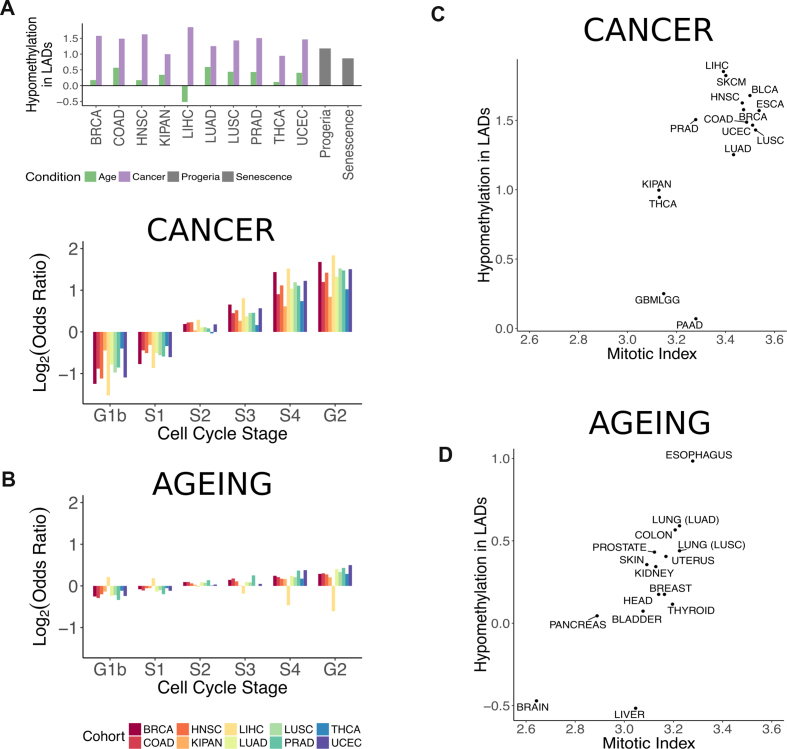
Differential methylation in lamina-associated domains. (A) Enrichment of hypomethylated probes in constitutive lamina-associated domains. The log2 of the odds ratio from Fisher's exact test is plotted for various conditions. Purple bars correspond to output from the linear regression models of cancer. Green corresponds to output from the linear regression models of ageing. Grey corresponds to probes output from the linear regression model of senescence and progeria. (B) Enrichment of hypomethylated probes depending on the replication timing of genomic regions in cancer (top) and ageing (bottom). The log2 of the odds ratio from Fisher's exact test is plotted per cell cycle stage. (C) Enrichment of hypomethylation in constitutive LADs (log2 of the odds ratio) in cancer versus estimated mitotic index in tumour samples (r = 0.66, P-value = 0.007; Pearson correlation). (D) Enrichment of hypomethylation in constitutive LADs (log2 of the odds ratio) in ageing versus estimated mitotic index in normal tissue (r = 0.76, P-value = 0.001; Pearson correlation). Correspondence between normal tissue labels and cohorts in the TCGA are the following: BLADDER – BLCA, BRAIN – GBMLGG, BREAST -BRCA, COLON – COAD, ESOPHAGUS – ESCA, HEAD - HNSC, KIDNEY – KIPAN, LIVER – LIHC, LUNG (LUAD) – LUAD, LUNG (LUSC) – LUSC, PANCREAS – PAAD, PROSTATE – PRAD, SKIN – SKCM, THYROID – THCA, UTERUS – UCEC.

