Figure 2.
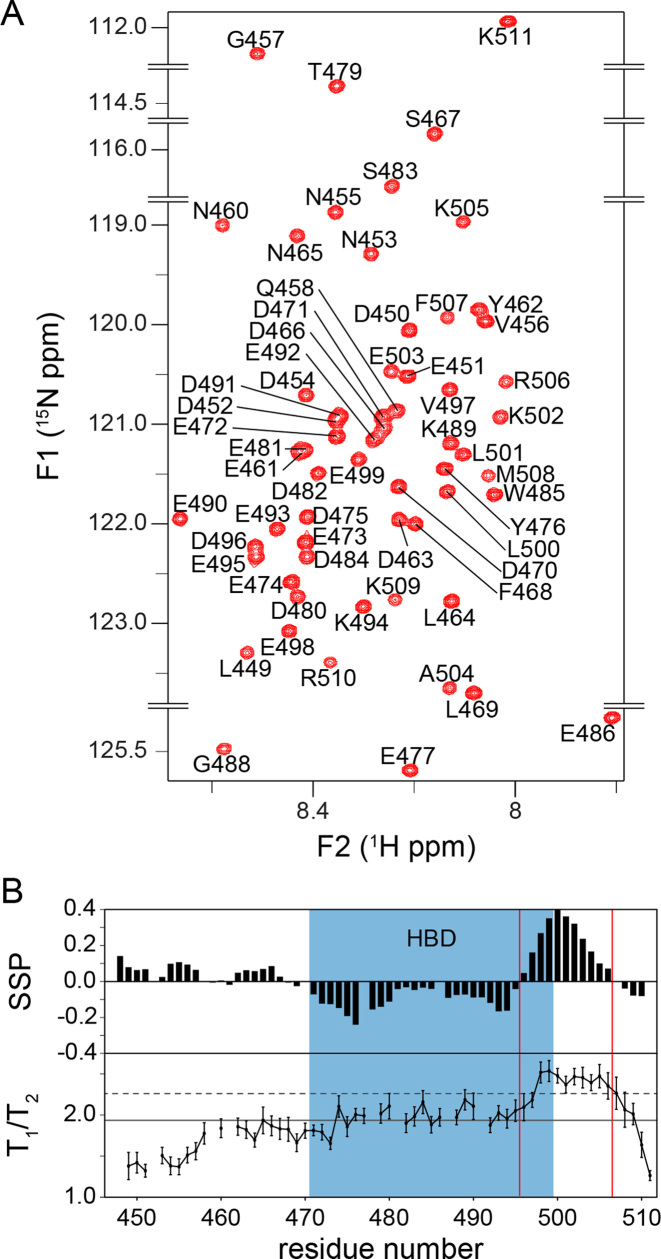
APLFAD is an unstructured protein domain. (A) Zoomed 1H-15N HSQC spectrum of APLFAD showing all backbone amide resonances with their assignments. Spectrum recorded at 22°C, 25 mM NaPi, pH 6.6, 300 mM NaCl, 900 MHz 1H Larmor frequency. (B) SSPs derived from NMR Cα and Cβ chemical shifts (upper panel) and experimental T1/T2 ratios from NMR relaxation measurements (lower panel) plotted against the sequence of APLFAD. In the SSP diagram, negative and positive values indicate the probability of β-strand and α-helical conformation, respectively. In the T1/T2 plot, the solid (dashed) lines represent the average (average + one standard deviation) value. HBD is indicated in blue, the boundaries of the region with helical propensity are indicated with red lines.

