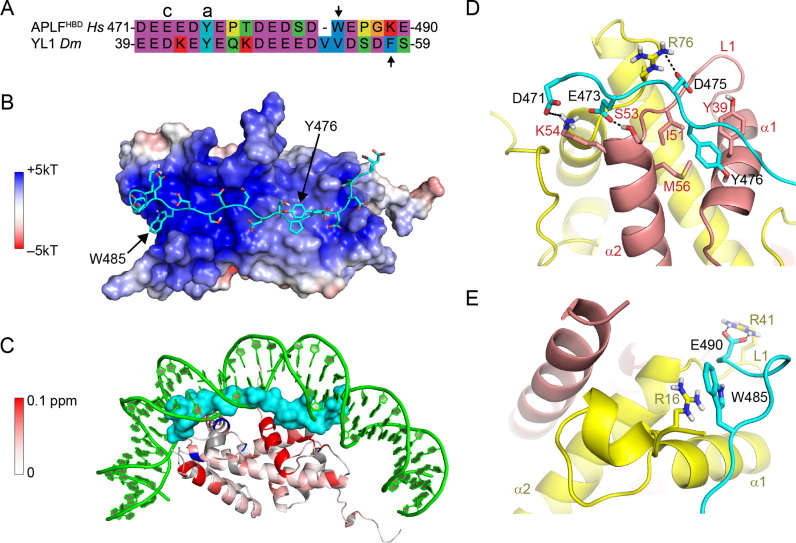
Figure 7.
Structural model of APLFHBD bound to H2A-H2B using two aromatic anchors. (A) Sequence alignment of APLFHBD with YL1 used as template for modeling. Cap (c) and anchor (a) residues are indicated, second aromatic residue is indicated with an arrow. (B) Double-anchor model for APLFHBD bound to H2A-H2B. APLFHBD in cartoon representation with sidechains shown as sticks. Electrostatic potential is color coded on the Van-der-Waals surface of H2A-H2B. (C) APLFHBD (surface representation) binds to NMR-derived binding interface and interferes with DNA binding to H2A-H2B. Color coding of CSPs as in Figure 5. (D and E) Close-up views on the two aromatic anchor interactions. Cap-anchor bound to H2B chaperone region in (D), second anchor bound to H2A α1–α2 patch in (E). APLFHBD in cartoon representation with sidechains shown as sticks. Selected residues and histone SS elements are labeled. Hydrogen bonds indicated with dashes. Green—DNA; cyan—APLF; yellow—H2A; red—H2B.

