Figure 2.
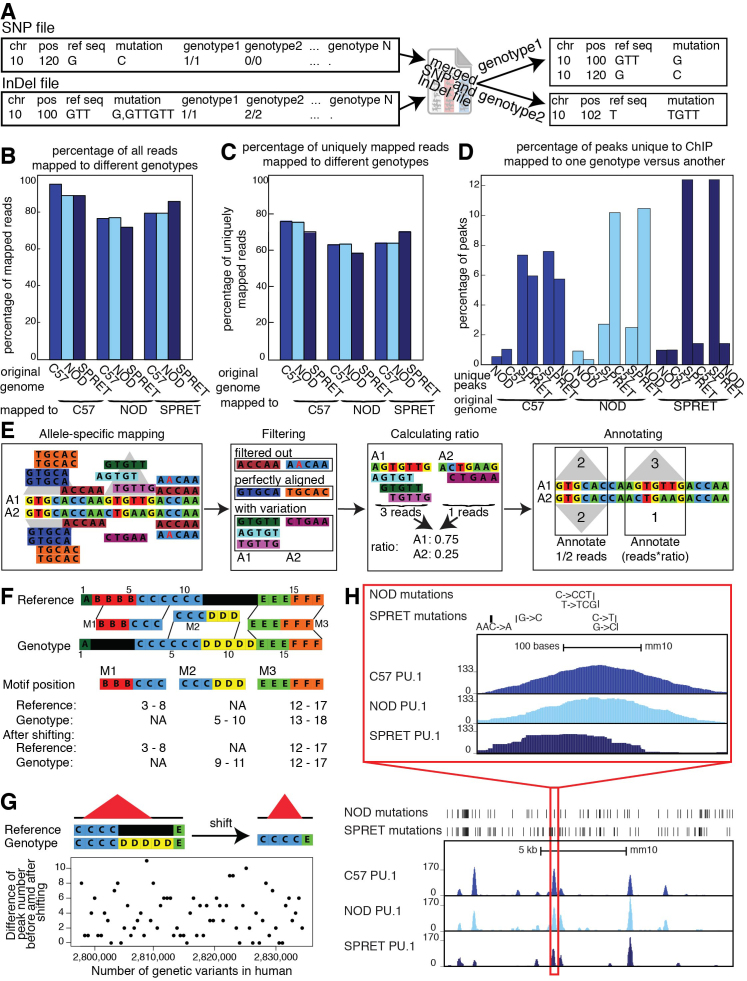
Details of pipeline: (A) MMARGE merges SNP and InDel VCF files and then splits the merged file. It finds the shortest annotation for each mutation, changing the original annotation from the VCF file. (B) Comparison of the overall mapping efficiency. There is a small decrease in overall mappability when data is mapped to the reference. (C) Comparison of mapping efficiency for uniquely mapped reads after mapping to different genomes. There is an increase in mapping performance when mapped to individualized genomes. (D) Percentage of peaks uniquely called to dataset mapped to one genotype versus another. Up to 12% of peaks are unique to one genotype. (E) Pipeline for processing heterozygous data: Data is mapped to both alleles and shifted back to the reference coordinates. Reads that do not uniquely align to the genome are filtered out. Perfectly aligned reads, as well as perfectly aligned reads overlapping mutations are filtered out and peaks are called on perfectly aligned reads. For each locus without any mutations, the peaks for both alleles are annotated with half the reads that mapped to this locus. For each locus with mutations a ratio is calculated based on the reads overlapping mutations and then the locus is annotated with the number of perfectly aligned reads multiplied by the corresponding ratio. (F) Schematic of the shifting process: Genomic coordinates of the individual genomes do not concur with the reference due to InDels. MMARGE shifts the individual coordinates to the reference without changing the length of the sequence. (G) Shifting peak coordinates leads to minor loss of peaks. 34 PU.1 ChIP-seq data sets were mapped and peaks were called before and after shifting. Even with 2 million genetic variants between the reference and the individualized genomes only up to 11 peaks are different. (H) UCSC genome browser shot showing PU.1 ChIP-seq data in large peritoneal macrophages in 3 different inbred strains of mice (C57, NOD, and SPRET). Bed graphs generated by MMARGE show genetic differences between the strains. The red rectangle shows a zoomed-in area of the UCSC genome browser.

