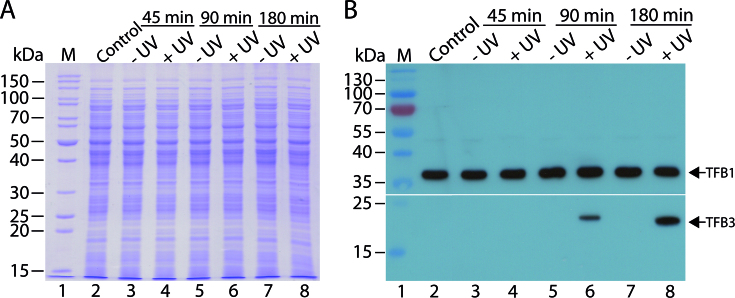
Figure 2.
Expression levels of the endogenously tagged TFB3 in UV-treated and untreated S. acidocaldarius (tfb3cSF) cells. (A) SDS-PAGE (12.5% (w/v) polyacrylamide; Coomassie staining) of crude extracts of tfb3CSF before the treatment (control) and 45, 90 and 180 min after the treatment with 100 J/m2 UV irradiation (+UV) or without UV irradiation (−UV). A total of 30 μg of protein extract was loaded per lane. M, PageRuler unstained protein ladder (Thermo Fisher Scientific). (B) Autoradiograph showing the expression of TFB3 (23 kDa) and TFB1 (35 kDa) before the treatment (control) and 45, 90 and 180 min after the treatment with (+UV) or without UV irradiation (−UV). To monitor both proteins, which show significant differences in size and expression level, the membrane was cut after the transfer and the parts were handled separately. For TFB3, an anti-FLAG-tag antibody was used as primary antibody with a dilution of 1:1000. As an internal loading control, TFB1 was detected using a polyclonal antibody raised in rabbit (dilution: 1:10 000). Both TFB1 and TFB3 were visualized using a HRP-coupled anti-rabbit-IgG as secondary antibody. The exposition time was 2 min for TFB3 and 5 s for TFB1. M, PageRuler prestained protein ladder (Thermo Fisher Scientific).

