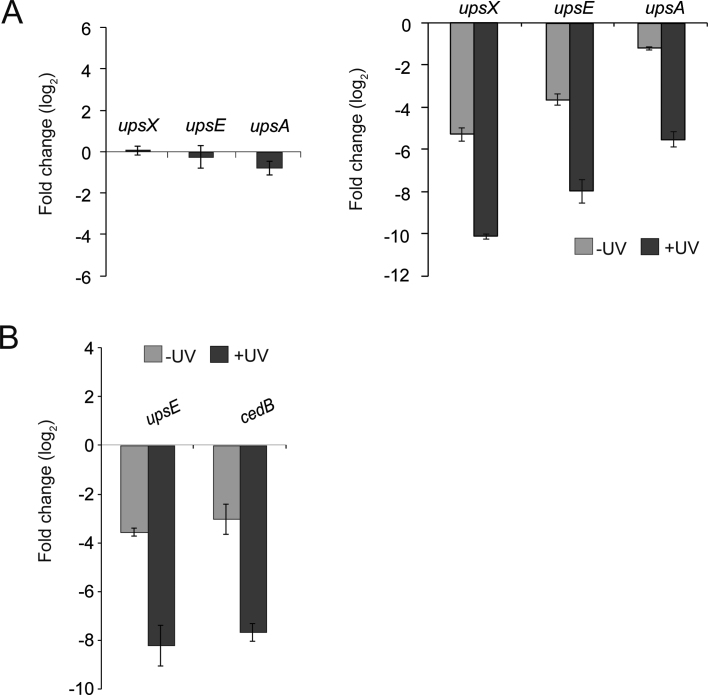
Figure 6.
qRT-PCR of selected genes involved in cellular aggregation and DNA exchange. (A) On the left: changes of transcription levels of upsX, upsE and upsA in the tfb3 insertion mutant tfb3::pyrEF upon UV treatment compared to non-induced cells displayed as log2 fold changes. On the right: transcription levels of upsX, upsE and upsA before (light gray bars) and 180 min after (dark gray bars) UV stress in tfb3::pyrEF in comparison to that of the reference strain MW001pyrEF+. (B) Transcription levels of upsE and cedB in not induced (light gray bars) and UV induced (dark gray bars) conditions in tfb3::pyrEF in comparison to that of MW001pyrEF+. Changes in transcription levels are displayed as log2.

