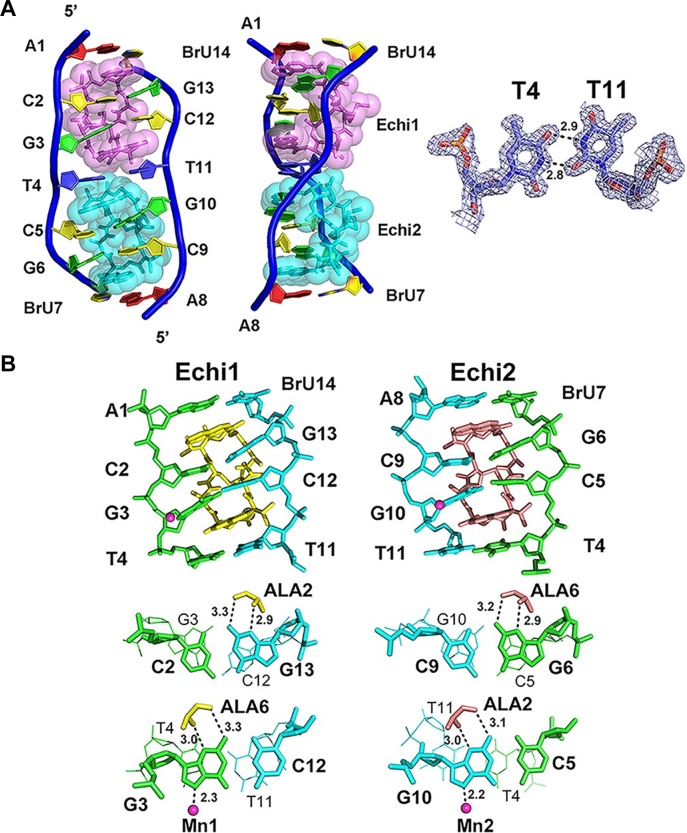
Figure 2.
Crystal structure of the echinomycin–TT duplex. (A) The asymmetric unit of the echinomycin–TT complex structure in front (left) and side (middle) views. Two echinomycin molecules bind to a duplex DNA containing one T:T mismatch. The 2Fo-Fc electron density of the T:T mismatch in the refined structure is shown at right, contoured at 1.0 σ. Hydrogen bonds are represented by dotted lines, with numbers indicating the distance between the two contributing atoms in Ångströms. (B) Skeletal models showing the antibiotic binding sites in the echinomycin–TT complex. The diagrams illustrate the stacking interactions and hydrogen bonding at the CpG steps. Mn2+ ions are shown as magenta spheres. Dotted lines represent the direct interactions between atoms, and numbers show the distances.

