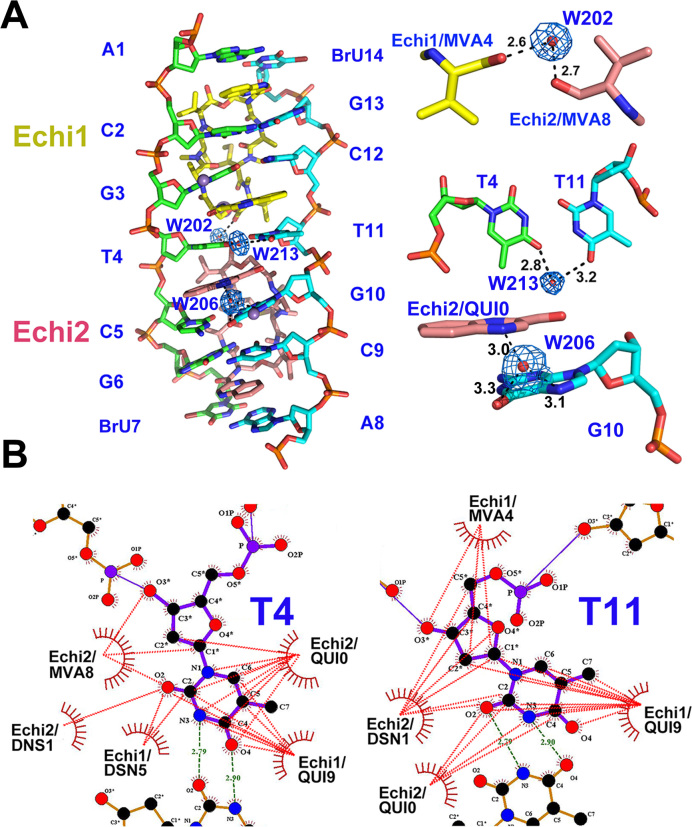
Figure 3.
Water-mediated and the hydrophobic interactions in the echinomycin–TT complex. (A) Overall structure (left) and close-up views (right) showing the water molecules that directly mediate the hydrogen-bonding interactions in the echinomycin–TT complex. The Mn2+ ions and water molecules are shown as purple and red spheres, respectively. The 2Fo – Fc electron density map is contoured at 1.0 σ to show the coordinated waters in the refined structure. Dashed lines show the direct hydrogen bonds between atoms, with the distance in Ångströms. (B) LigPlot+ 2D plots to illustrate the hydrophobic interaction (red dashed lines) between echinomycin molecules and the T4 (T11) base in the complex.

