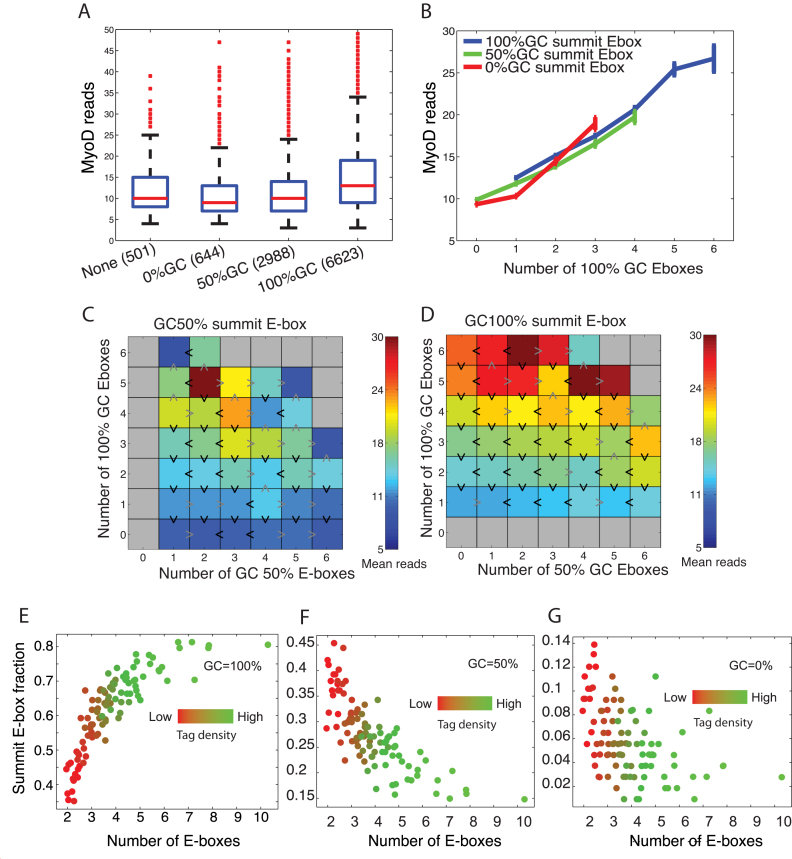
Figure 4.
The role of the summit E-box in binding affinity. (A) MyoD reads per peak grouped depending on the GC-content of the E-box nearest the peak summit. (B) Mean MyoD reads within peaks as a function of number of E-boxes, separating by the type of the summit E-box. (C and D) Heatmaps showing MyoD reads as a function of numbers of 100% GC and 50% GC E-boxes within 200 bp of the peak summit, and separating by the type of the summit E-box. (E–G) The relationship between tag density (mean sequenced reads) and single summit E-box motif and enrichment of MyoD reads. Peak summit was determined by MACS and summit E-box is the closest motif to the summit.

