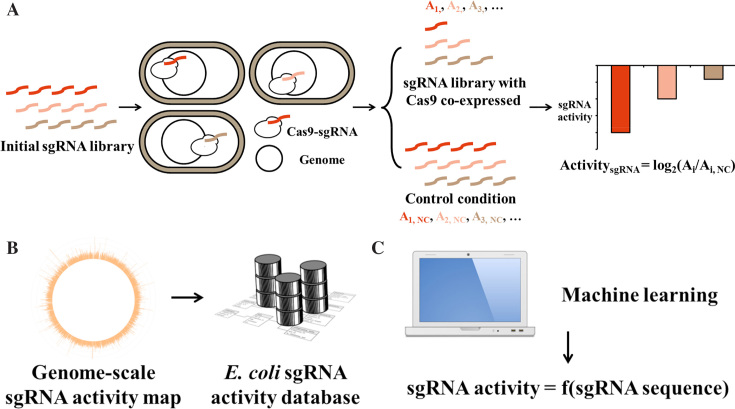
Figure 1.
General framework combining experimental and computational approaches to depict a genome-wide sgRNA activity map in this work. (A) Schematic illustration of the workflow for the sgRNA activity screening experiments. The variable regions of a genome-wide sgRNA library are synthesized as oligomers on a microarray. The oligomers are subsequently amplified and cloned into an sgRNA expression vector by Golden Gate assembly. The constructed sgRNA library is transformed into E. coli host cells expressing Cas9 (selective condition) or dCas9 (control condition) protein. After cultivation in LB medium, the extracted sgRNA plasmids are amplified by PCR, and the abundance of each sgRNA is determined by NGS. The sgRNA activity is defined as the log2 change in abundance between the selective (Ai) and control (Ai,NC) conditions. (B) The obtained genome-wide sgRNA activity map can be used directly in sgRNA selection for a genome-editing project in E. coli (the best sgRNA for every gene, promoter and RBS encoded by E. coli genome). (C) A machine learning approach is used to shed light on the sequence–activity relationship (sgRNA activity = f (sgRNA sequence)) of sgRNAs to provide more biophysical insight into CRISPR/Cas9-based genome editing as well as to extend the sgRNA activity prediction capacity to other prokaryotic organisms.

