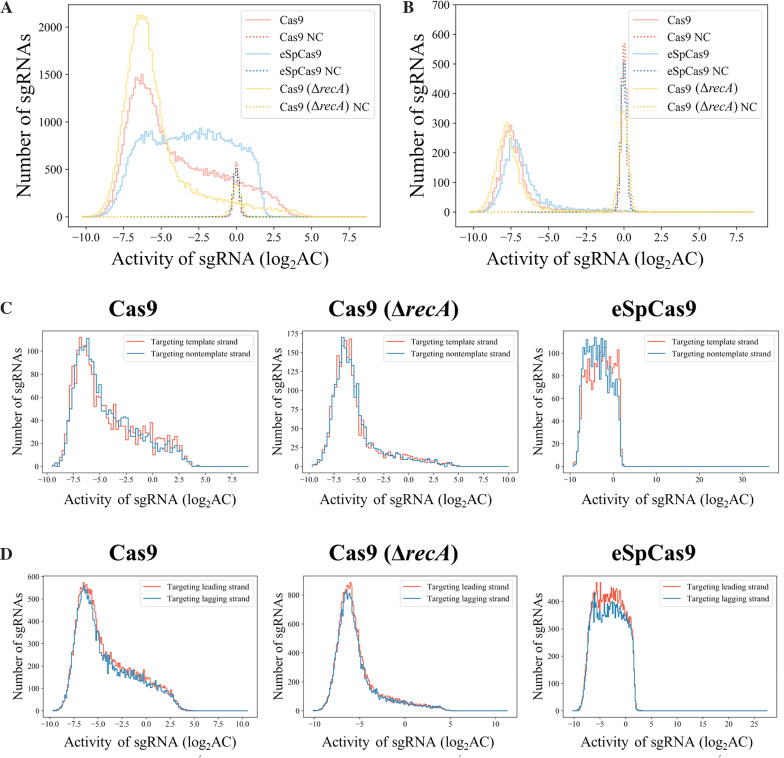
Figure 3.
Diversity of activity among sgRNAs. (A) The distribution of sgRNA activity in conjunction with Cas9, eSpCas9 and Cas9 in the ΔrecA genetic background (Cas9 (ΔrecA)). The activity distributions of negative control sgRNAs under these three conditions are also presented as references. (B) Distribution of the sgRNA with the strongest activity among all sgRNAs targeting each gene (under the three conditions as in (A)). Only genes with at least three sgRNAs were included (4,020 genes). (C) Activity comparisons between sgRNAs targeting the template or nontemplate strand in the gene-coding regions. A two-tailed MW U-test was used to test for significant differences. Cas9 dataset: 2,180 vs. 2,163 (template versus nontemplate sgRNAs, respectively, here and below), P = 0.794; Cas9 (ΔrecA) dataset: 2180 versus 2163, P = 0.316; eSpCas9 dataset: 2220 versus 2265, P = 10−11.2. (D) Activity comparisons between sgRNAs targeting the leading or lagging strand during replication across the E. coli chromosome. A two-tailed MW U-test was used to test for significant differences. Cas9 dataset: 27 356 versus 25 180 (leading strand versus lagging strand sgRNAs, respectively), P = 0.006; Cas9 (ΔrecA) dataset: 27 356 versus 25 180, P = 0.003; eSpCas9 dataset: 29 168 versus 26 213, P = 0.398.

