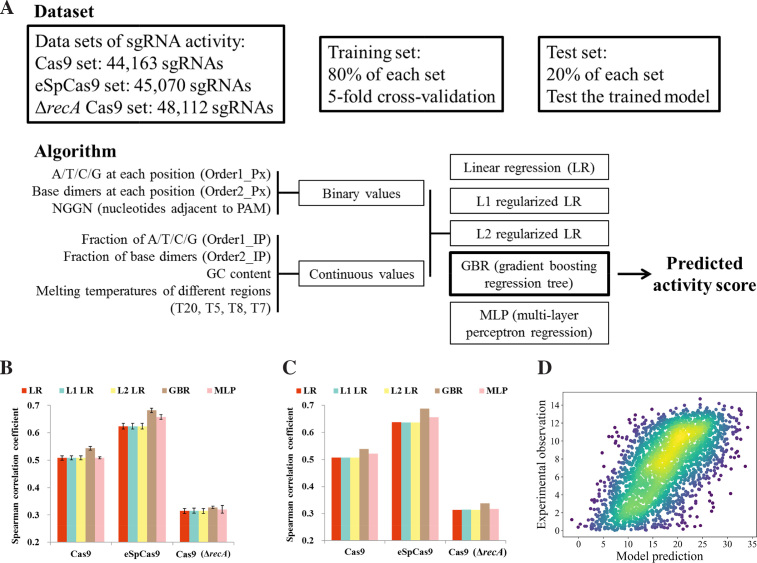
Figure 5.
Machine learning model reliably predict sgRNA activities. (A) Schematic of machine learning dataset and algorithm. Three machine learning models (Cas9, eSpCas9 and Cas9 (ΔrecA)) were constructed, respectively. 80% sgRNAs of the relevant dataset was used as the training set by five fold cross-validation to train the model. We reserved 20% of the sgRNAs in each set (Cas9, eSpCas9 and Cas9 (ΔrecA)) as the test set to measure the generalization ability of each model to predict unseen data. We extracted 425 features for each sgRNA. Five varieties of machine models are trained for each dataset (Cas9, eSpCas9 and Cas9 (ΔrecA)) and gradient boosting regression tree is found generally to perform best. (B) Comparison of the different models. Using fivefold cross-validation, the models were trained with the training set by 5-fold cross-validation. The bar plot shows the mean ± s.d. for the Spearman correlation coefficient between predicted and measured sgRNA activity scores (n = 5). (C) Comparison of the generalization ability of different varieties of models. Models were trained on the intact training set with fixed parameters optimized during cross-validation. The Spearman correlation coefficient is shown for the predicted and measured sgRNA activity scores in the test set. (D) The generalization ability of the trained model was further validated by predicting activities from a dataset obtained from an independent sgRNA library and experiment. One additional sgRNA activity dataset (the same as that in Figure 2C) was constructed by screening the tiling library (2640 sgRNAs passed quality control, including 901 members that were also present in the genome-wide library) using the same protocol. Predictions of sgRNA activity from this dataset based on the eSpCas9 model trained on all the available data (training plus test set in (A)) are plotted against experimentally obtained scores. Each point on the plots represents a unique sgRNA and color denotes the scatter density. Spearman correlation coefficient: 0.6329, P = 10−294.8.

