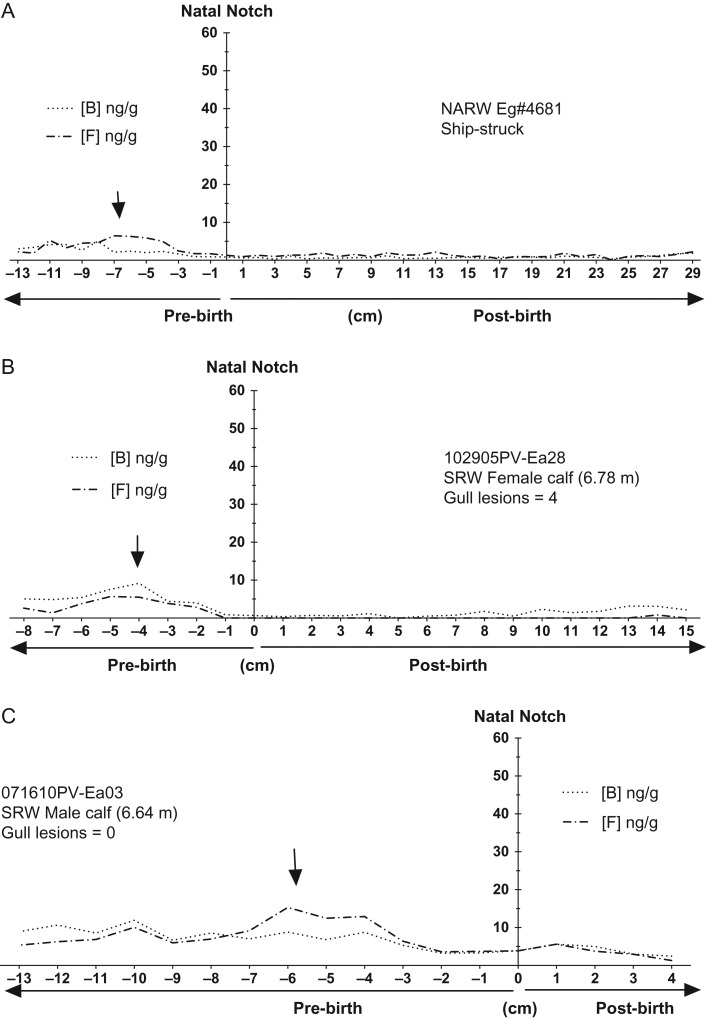
Figure 3:
Immunoreactive cortisol (dashed line) and corticosterone (dotted line) across the full length of baleen plates from right whale calves with low or no evidence of chronic wounding: (A) NARW, male calf ‘Eg #4681’; (B) SRW female calf ‘102905PV-Ea28’; and (C) SRW male calf ‘071610PV-Ea03’. The Y axis is centred at the ‘natal notch’ (zero on the X axis) indicating birth. Y axis is scaled to 60 ng/g to allow comparisons with the highly wounded calves (Fig. 4). X-axis indicates cm above the natal notch, i.e. positive values along the X-axis denote post-natal baleen growth whereas negative values indicate pre-natal growth. Arrows indicate ‘knolls’, regions with relatively higher elevations in glucocorticoids which could be associated with maternal GCs for the late pregnancy stages. In figure legend, B = corticosterone and F = cortisol.

