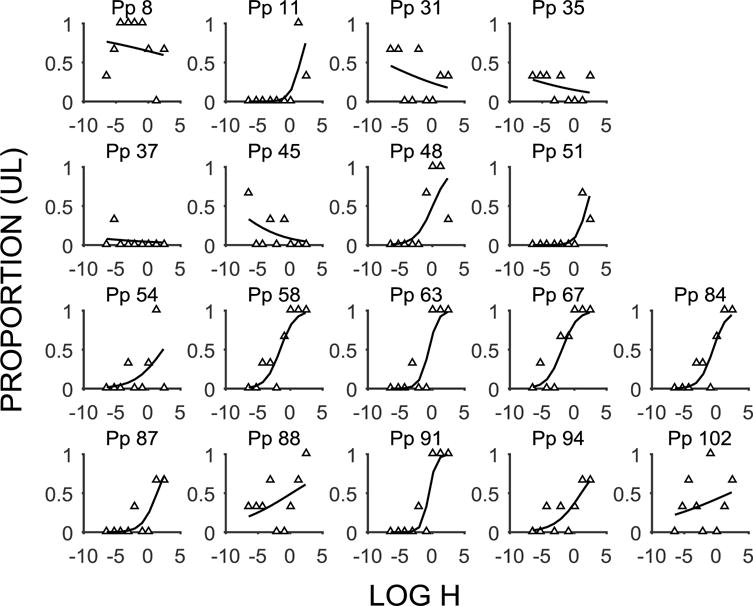
Figure 6.

Probability discounting functions (mean proportion of UL choices as a function of the log h-value) for individuals identified as Type 1 nonsystematic by the algorithm and identified as having deviant estimates by the mixed effects model. The white triangles are the individual data points and the lines are the model fits for individual participants (Pp).
