
Figure 9.
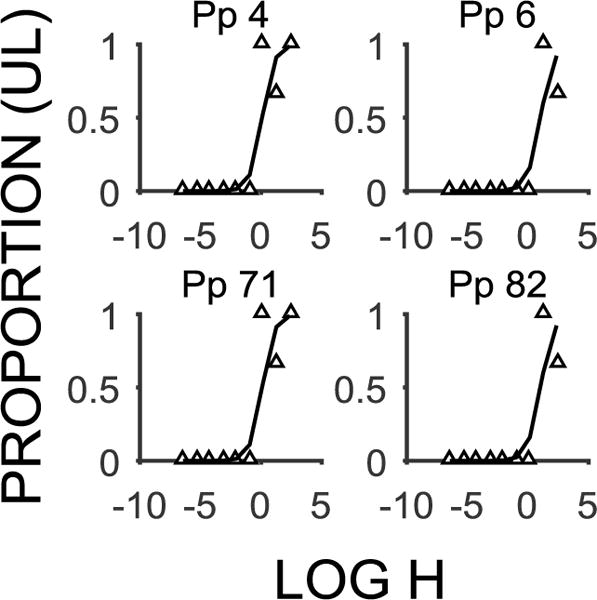
Probability discounting functions (mean proportion of UL choices as a function of the log h-value) for individuals identified as Algorithm Type 1, but who were not deviant in the mixed effects model. All Algorithm Type 2 participants were identified as having deviant estimates. The white triangles are the individual data points and the lines are the model fits for individual participants.