
Figure 6. Microbial dysbiosis in Lewis and Fischer rats.
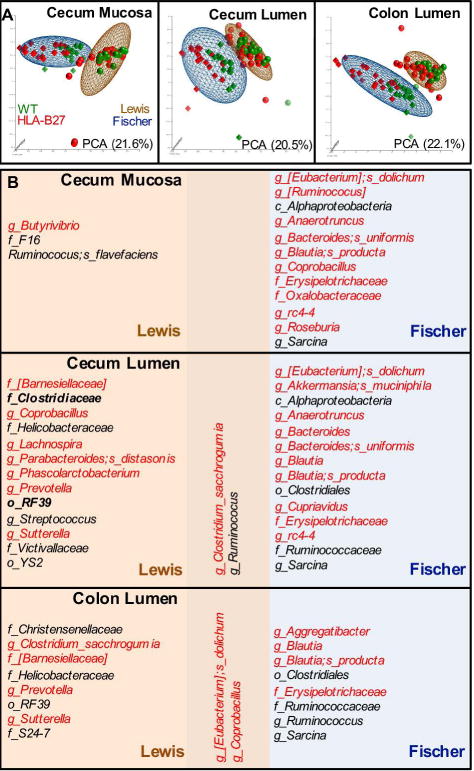
A, PCA of species level data from samples taken from the sites indicated. Each data point represents the first three principal components from the analysis of a single sample from one animal. The distribution of samples from Lewis (sphere) and Fischer (tetrahedron) backgrounds are represented by ellipsoids (brown and blue, respectively), with HLA-B27 and wild-type genotypes indicated by red and green, respectively. B, Overlap between HLA-B27-induced dysbiosis on Lewis and Fischer backgrounds. Microbes with increased (red) or decreased (black) relative frequencies in HLA-B27 transgenic rats compared to wild-type are listed. All microbes shown are differentially represented in HLA-B27 Lewis and Fischer rats (p <0.05, q<0.1).