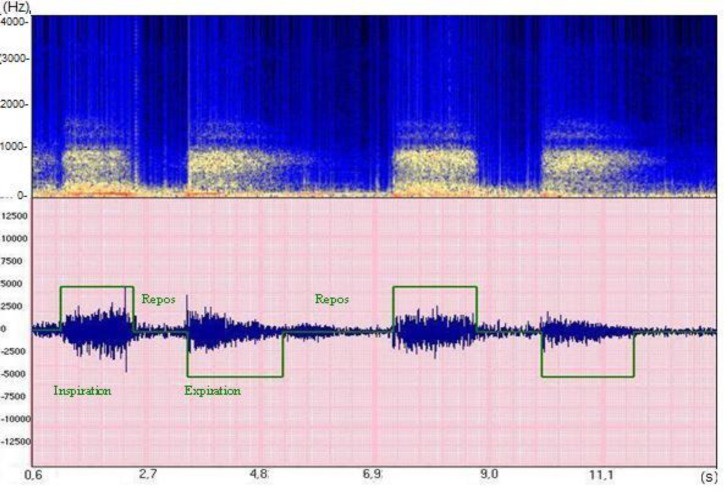
Fig. 3.
Breathing cycles. This represents the time and frequency characteristics of normal vesicular sounds. The upper green square represents the inspiration phase and the lower one the expiration. This example illustrates that there is relatively the same frequency range in both phases. Intensity decreases during expiration, mainly due to the loss in high pitches. In both phases, the frequency energy is distributed between some Hz and 1 kHz. The red line corresponds to a maximum of energy below 100 Hz (data collected in the ASAP project [Analysis of Auscultatory and Pathological Sounds] developed by the French National Agency for Research [ANR 2006 - TLOG 21 04]).

