. 2018 Aug 10;7:e35786. doi: 10.7554/eLife.35786

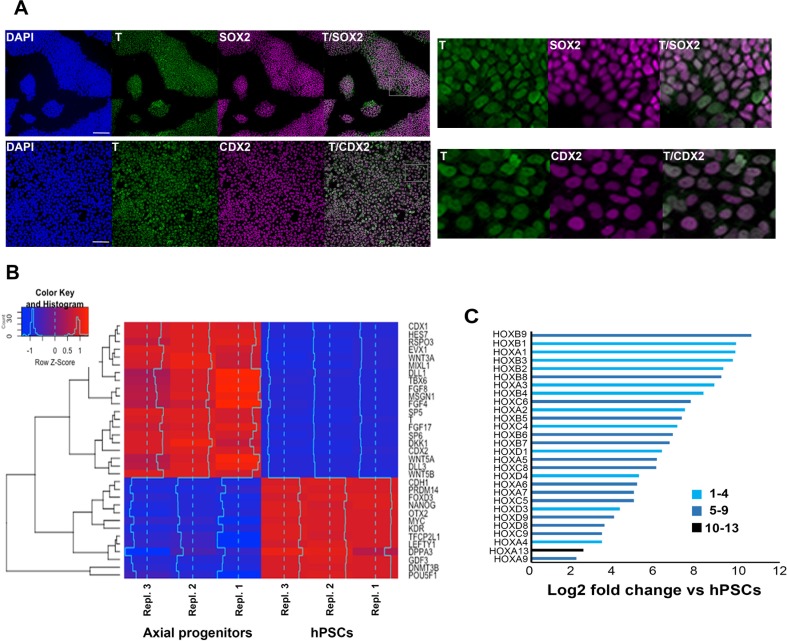
Figure 1. Transcriptome analysis of in vitro-derived human axial progenitors.

(A) Immunofluorescence analysis of expression of indicated markers in day 3 hPSC-derived axial progenitors. Magnified regions corresponding to the insets are also shown. Scale bar = 100 µm. (B) Heatmap showing the expression values of selected markers in three independent axial progenitor and hPSC sample replicates. The expression values (FPKM) were scaled to the row mean. The color key relates the heat map colors to the standard score (z-score). (C) Induction of all significantly upregulated HOX transcripts in axial progenitors relative to hPSCs. Paralogous HOX groups corresponding to different axial levels such as cervical (groups 1–4), brachial/thoracic (groups 5-9)and lumbosacral (groups 10-13) are indicated.

Figure 1.

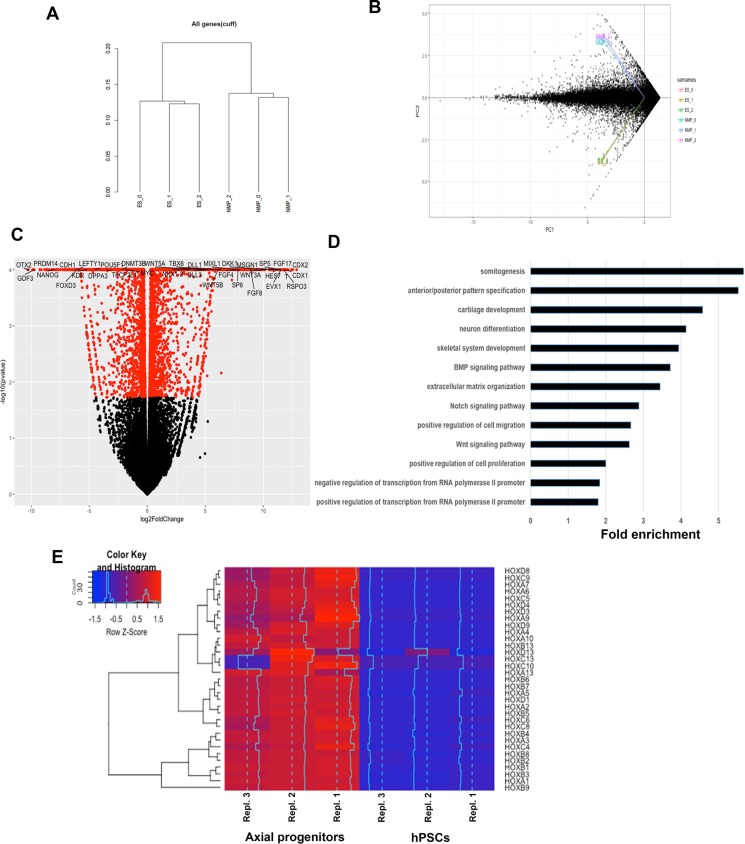
Figure 1—figure supplement 1. RNASeq analysis of in vitro-derived axial progenitors.

Figure 1—figure supplement 1.

(A) Dendrogram showing the clustering of the individual axial progenitor (NMP) and hESC sample replicates based on RNAseq expression data. (B) Principal Component Analysis (PCA) plot indicates a good separation, in terms of gene expression, between the two conditions and a good replication among samples. (C) Volcano plot reporting pvalue (y axis) as a function of log2 fold change (x axis) between the axial progenitor and hPSC groups. The red dots depict significant genes (pvalue <= 0.05). Top differentially expressed transcriptional regulators of axis elongation and WNT/FGF/NOTCH/RA signalling pathway components are shown. (D) Top gene ontology groups significantly enriched in axial progenitors vs hPSCs. (E) Hierarchical clustering heatmap showing the expression values of HOX genes in axial progenitor and hPSC sample replicates. The expression values (FPKM) were scaled to the row mean. The color key relates the heat map colors to the standard score (z-score).