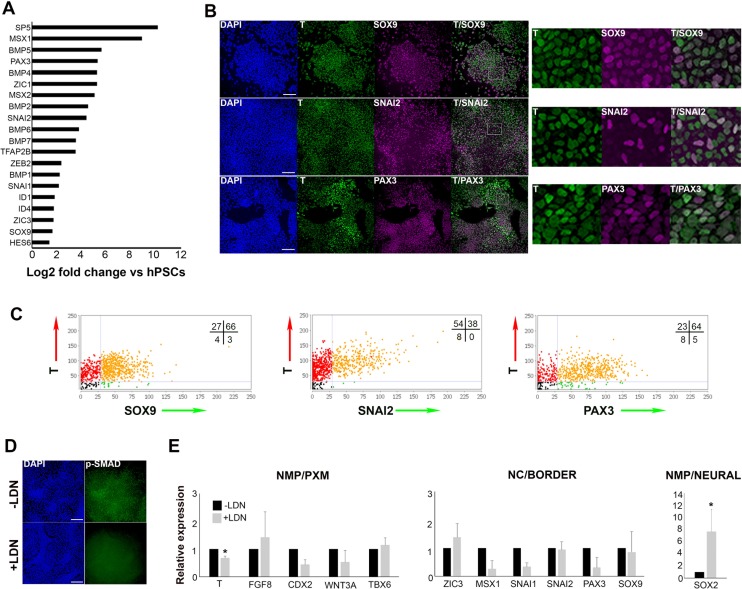
Figure 2. Human axial progenitor cultures exhibit a neural crest/border signature.
(A) Log-fold induction of representative neural crest/neural plate border and BMP-associated transcripts in axial progenitors compared to hESCs. (B) Immunofluorescence analysis of expression of indicated markers in axial progenitors. Magnified regions corresponding to the insets are also shown. Scale bar = 100 µm. (C) Graphs showing the correlation of indicated NC/border markers with T in hPSC-derived (MasterShef7 line) axial progenitors. Each graph corresponds to one scored representative random field and reflects the results from the analysis of 3–5 random fields. Numbers in each quadrant represent percentages of cells belonging to different categories. Numbers of nuclei analysed in each graph: N = 785 (T-SOX9), N = 940 (T-SNAI2), N = 720 (T-PAX3). (D) Immunofluorescence analysis of expression of phosphorylated SMAD1/5 (p-SMAD) in the presence and absence of the BMP inhibitor LDN193189 (LDN). Scale bar = 100 µm. (E) qPCR expression analysis of indicated markers in axial progenitors in the presence (+) or absence (-) of LDN. Error bars = S.D. (n = 3). In all cases nuclei were counterstained with DAPI. PXM, paraxial mesoderm; NC, neural crest. *p<0.05, Paired t-test.


