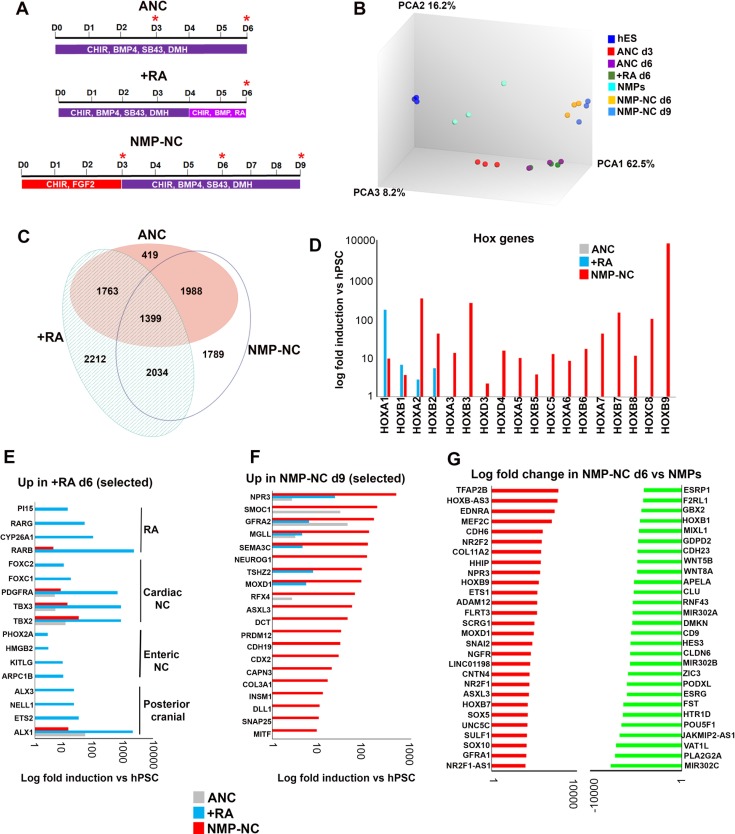
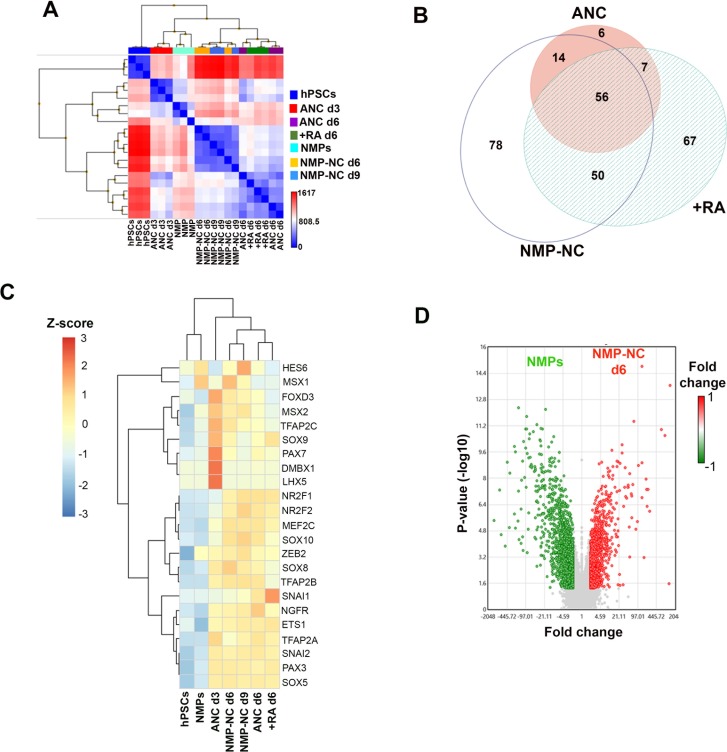
Figure 4. Transcriptome analysis of in vitro derived neural crest cells corresponding to distinct axial levels.
(A) Diagrams showing the culture conditions employed for generating NC cells of distinct axial identities using hPSCs. Asterisks indicate the timepoints used for sample harvesting and transcriptome analysis. D, day of differentiation. ANC, Anterior neural crest. (B) Principal component analysis depicting variance between different samples used for microarray analysis (timepoints shown in A). (C) Venn diagram showing the overlap between all significantly upregulated (≥2 fold relative to undifferentiated hESCs, FDR ≤ 0.05) in each indicated NC group. (D) Log fold induction of selected HOX genes in indicated NC populations relative to hPSCs. (E) Log fold induction of representative significantly upregulated (≥2 fold relative to undifferentiated hPSCs, FDR ≤ 0.05) transcripts marking day 6 RA-treated NC cells. (F) Log fold induction of representative significantly upregulated (≥2 fold relative to undifferentiated hPSCs, FDR ≤ 0.05) transcripts marking day nine axial progenitor-derived NC cells. (G) Log fold changes in the expression of the most-upregulated and most-downregulated transcripts in day six axial progenitor-derived NC precursors compared to d3 hPSC-derived axial progenitors.


