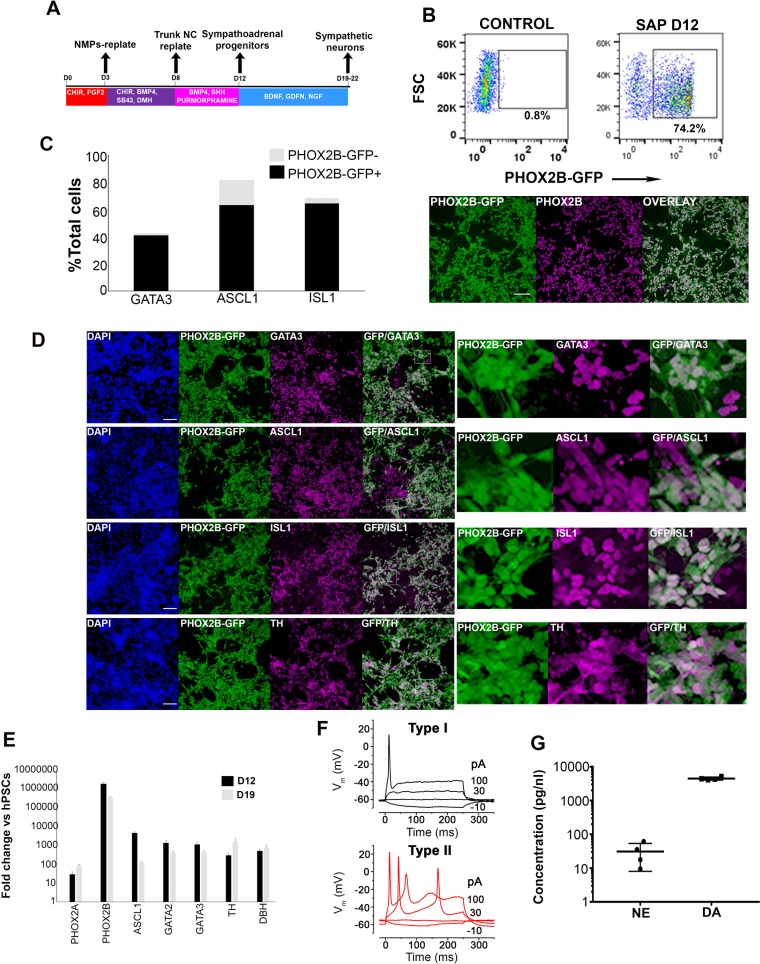
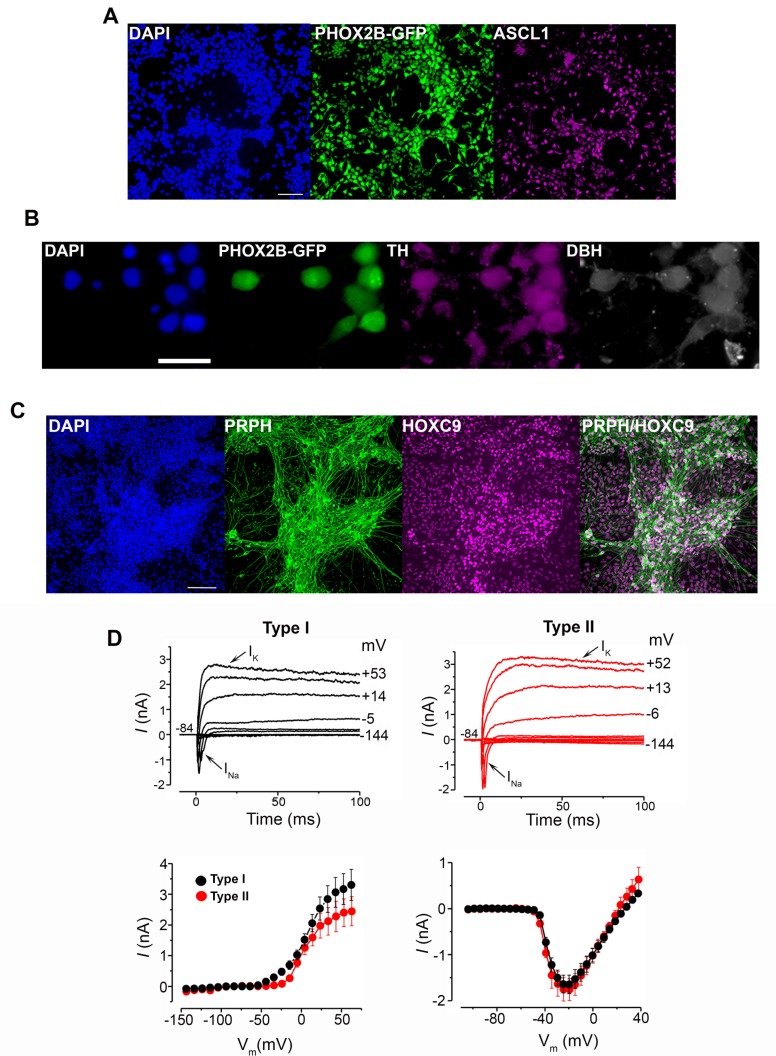
Figure 5. Axial progenitor-derived trunk neural crest is an optimal source of sympathoadrenal cells.
(A) Diagram depicting the culture conditions employed to direct axial progenitors (‘NMPs’) toward trunk NC and subsequently sympathoadrenal progenitors (SAP) and sympathetic neurons. (B) FACS analysis of PHOX2B-GFP expression in SAP cells derived from axial progenitors as shown in A. Below: Immunofluorescence analysis of PHOX2B-GFP and PHOX2B protein expression following antibody staining. Scale bar = 100 µm. (C) Quantification of d18 differentiated cells positive for the indicated markers in relation to PHOX2B-GFP expression following antibody staining. In each case four randomly selected representative fields were used to obtain the average number of cells/marker. Total numbers of cells scored: GATA3 (N = 3003), ASCL1 (N = 2575), ISL1 (N = 2963). (D) Immunofluorescence analysis of PHOX2B-GFP together with the indicated markers in day 18 differentiated SAP/sympathetic neurons derived from axial progenitors as shown in A. Scale bar = 100 µm. (E) qPCR expression analysis of indicated SAP/sympathetic neuron markers in d12 and d18 cultures. Error bars = S.E.M. (n = 3). (F) Voltage responses of hPSC-derived sympathetic neurons (after day 19 of differentiation) to current injection. Type I and Type II cells were current clamped and hyperpolarising (negative) and depolarising (positive) current steps were applied (the current injected is shown next to the traces). The resulting membrane potential responses of the cells to these current injections are shown, the traces are overlaid. (G) Analysis of catecholamine production in hPSC-derived sympathetic neurons (after day 19 of differentiation) using a commercial ELISA kit (n = 2). NE, norepinephrine; DA dopamine.


