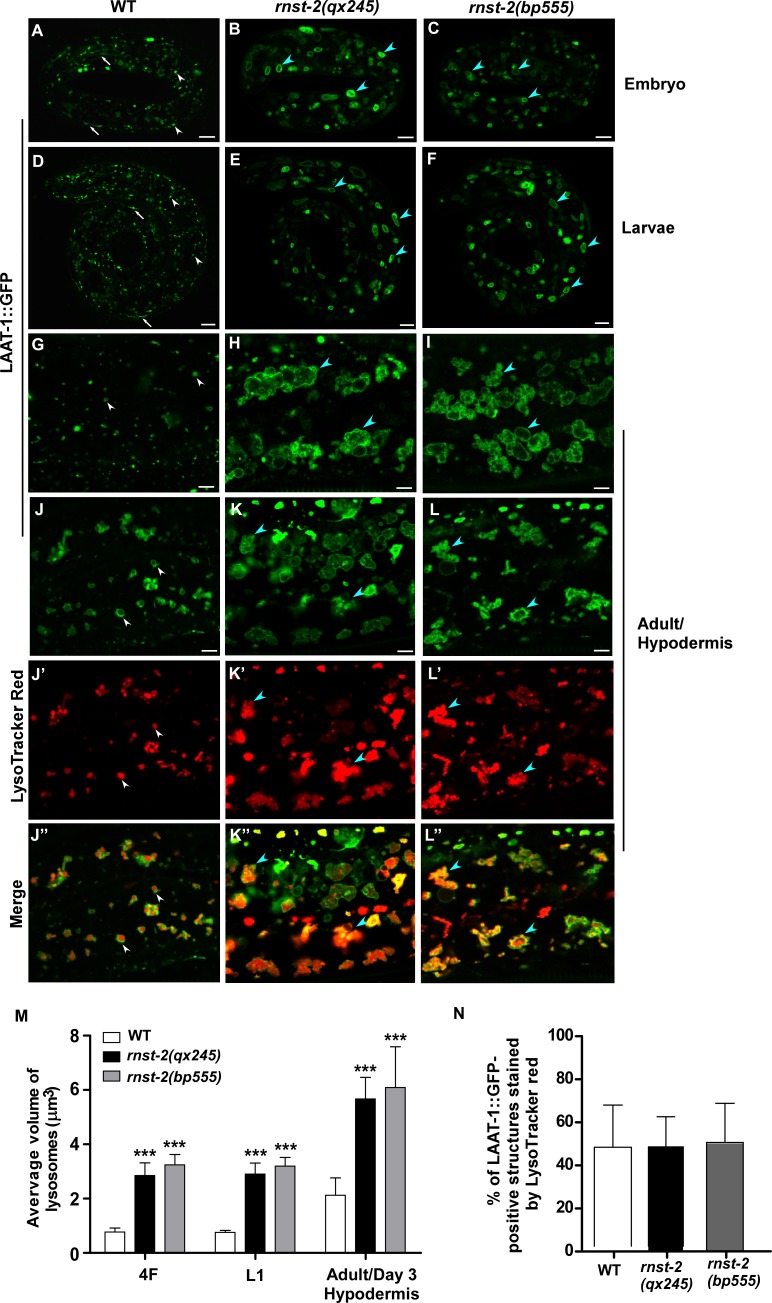
Figure 1. rnst-2 mutants accumulate enlarged lysosomes.
(A–I) Confocal fluorescence images of embryos at the 4-fold stage (4F, A–C), larvae 1 (L1, D–F) and adult hypodermis (G–I) in wild-type (WT, A, D, G), rnst-2(qx245) (B, E, H) and rnst-2(bp555) (C, F, I) expressing LAAT-1::GFP. (J–L”) Confocal fluorescence images of the hypodermis in wild-type (J–J″), rnst-2 (qx245) (K–K″) and rnst-2(bp555) (L–L″) adults expressing LAAT-1::GFP and stained by Lysotracker red. In (A–L’’), white arrowheads and arrows indicate globular and tubular lysosomes, respectively, and blue arrowheads indicate enlarged globular lysosomes. Scale bars: 5 µm. (M) Quantification of the average volume of lysosomes labeled by LAAT-1::GFP in 4-fold-stage embryos (4F), L1 larvae (L1) and adult hypodermis (day 3 of adulthood). (N) The percentage of LAAT-::GFP-positive lysosomes that were stained by lysotracker red was quantified in adult hypodermis. In (M, N), at least 10 worms were scored in each strain at each stage. Data are shown as mean ± SD. Two-way ANOVA with the Bonferroni post hoc test (M) or one-way ANOVA with Tukey’s post hoc test (N) was performed to compare mutant datasets with wild type. ***p<0.001, other points had p>0.05.


