. 2018 Aug 13;7:e36588. doi: 10.7554/eLife.36588

Figure 3. Loss of RNST-2 causes accumulation of rRNA and ribosomal proteins in lysosomes in an autophagy-dependent manner.

(A, C) RNA purified from lysosomes in the indicated strains was examined by agarose gel electrophoresis. Full processing of the lysosomal cathepsin CPL-1 (dc-CPL-1) was used to normalize the amount of lysosomes in each strain. The total extracted RNA was quantified and normalized to 1-fold in wild type (A, C, right panel). Abundant 26S and 18S rRNA was observed in lysosomes of rnst-2(qx245) mutants. At least three independent experiments were performed and data are shown as mean ± SD. (B, D) Accumulation of ribosomal proteins (large subunit: RPL-5, RPL-25.2; small subunit: RPS-3 and RPS-0) and LGG-1 in lysosomes was examined by western blot analysis in the indicated strains. Full processing of the lysosomal cathepsin CPL-1 (dc-CPL-1) was used to normalize the amount of lysosomes in each strain. (E–H) 3D reconstitution of the fluorescence images in 10–15 z-series (0.5 µm/section) in L1 larvae of the indicated strains expressing LAAT-1::GFP. Enlarged lysosomes (arrowheads) were observed in rnst-2(qx245). (I) Quantification of the average volume of lysosomes in the strains shown in (E–H). At least 10 worms were scored in each strain and data are shown as mean ± SD. In (A, C, I), one-way ANOVA with Tukey’s post hoc test was performed to compare all other datasets with wild type or datasets that are linked by lines (I). ***p<0.0001, N.S.: no significance.

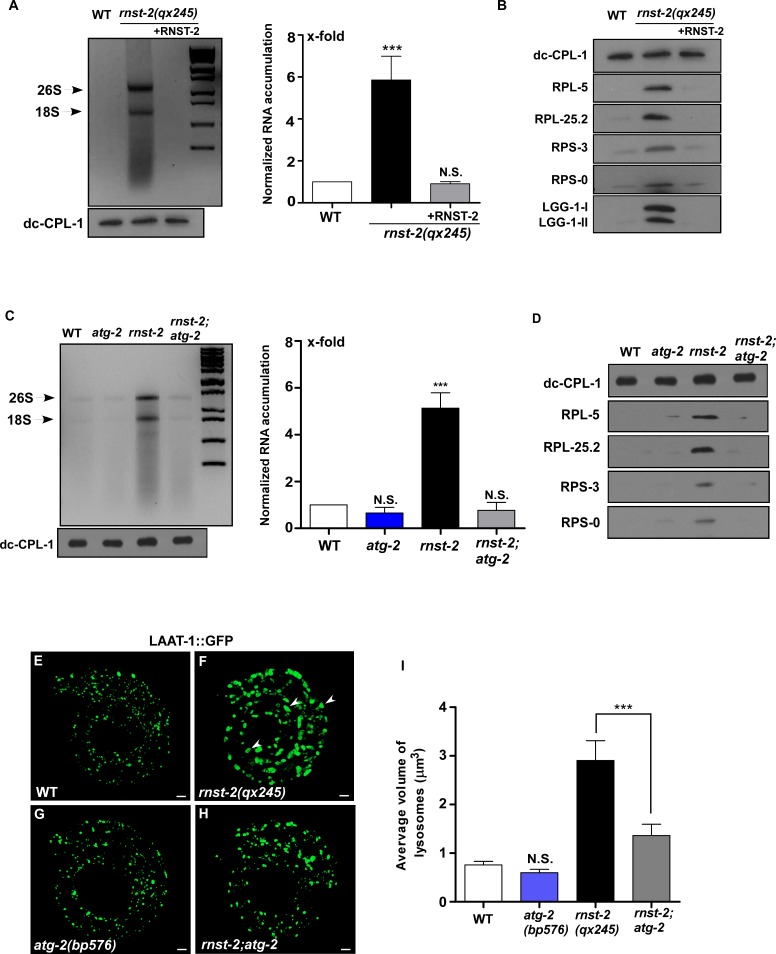
Figure 3—source data 1. Figure 3 numerical data.
DOI: 10.7554/eLife.36588.011
Figure 3—source data 2. Figure 3—figure supplement 1 numerical data.
DOI: 10.7554/eLife.36588.012
Figure 3—source data 3. Figure 3—figure supplement 2 numerical data.
DOI: 10.7554/eLife.36588.013

Figure 3.

Figure 3—figure supplement 1. Lysosomal accumulation of rRNA and ribosomal proteins in rnst-2 is suppressed by blocking autophagy.

Figure 3—figure supplement 1.

(A) The processing of the lysosomal cathepsin CPL-1 is revealed by western blot using anti-CPL-1 antibodies (full length: 38 KD, processed active form: 27 KD), and was used to determine the enrichment of lysosomes in different fractions (B1-4) separated by a density gradient as described in the Materials and methods. Fraction B3 was used as the purified lysosomal fraction (PLF). (B) The purity of PLF was examined by western blot using antibodies that recognize proteins in nuclei (anti-HEL-1), mitochondria (anti-HSP-60), endosomes (anti-RME-1) or ribosomes (anti-RPL-5, anti-RPL-25.2, anti-RPS-3, anti-RPS-0). The whole worm lysate (WL) and PLF was normalized using fully processed CPL-1. (C–F) Accumulation of RNA (C, E) and ribosomal proteins (D, F) in lysosomes was examined in the indicated strains. Fully processed CPL-1 (dc-CPL-1) was used to normalize the amount of lysosomes in different strains. Total RNA purified from lysosomes was quantified and normalized as 1-fold in wild type. At least three independent experiments were performed and data are shown as mean ± SD. (G–L) 3D reconstitution of the fluorescence images in 10–15 z-series (0.5 µm/section) in L1 larvae of the indicated strains expressing NUC-1::CHERRY. Arrowheads indicate enlarged lysosomes in rnst-2(qx245). (M) Quantification of the average volume of lysosomes in the indicated strains. At least 10 worms were quantified in each strain and data are shown as mean ± SD. In (C, E, M), Student’s two-tailed unpaired t test (C) or one-way ANOVA with Tukey’s post hoc test (E, M) was performed to compare other datasets with wild type or datasets that are linked by lines. ***p<0.0001, N.S.: no significance.
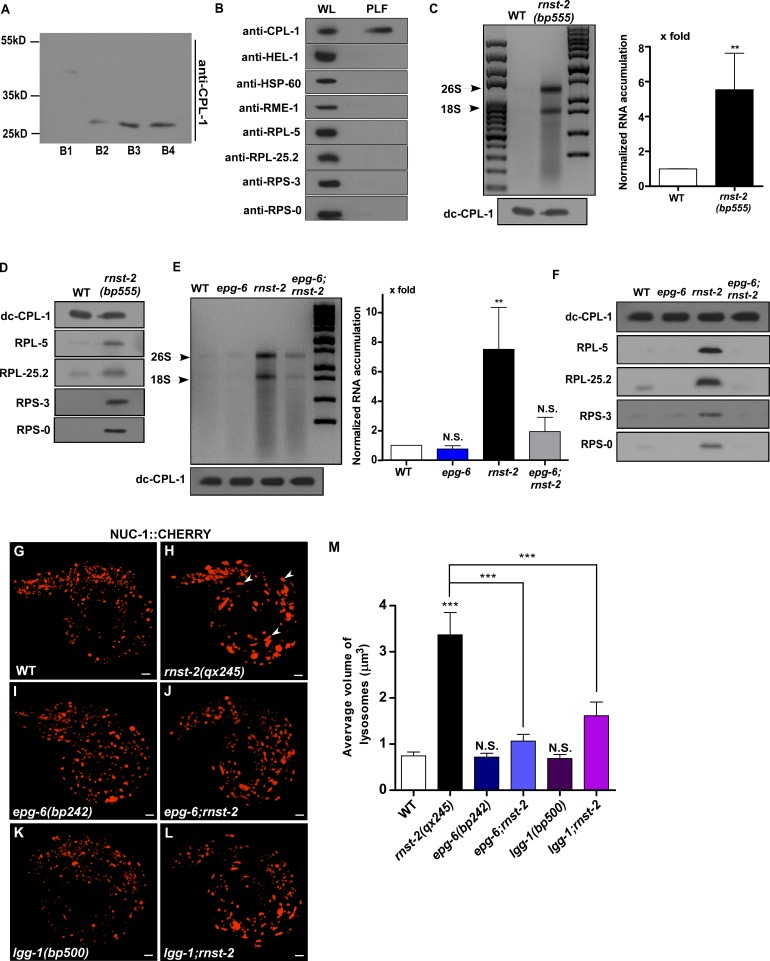
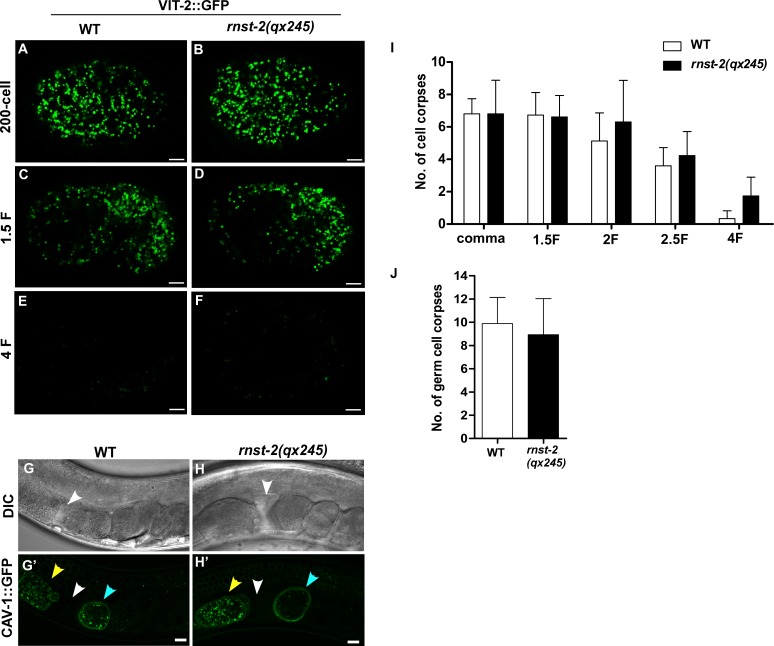
Figure 3—figure supplement 2. Loss of RNST-2 does not affect degradation of endocytic and phagocytic cargos.

Figure 3—figure supplement 2.

(A–F) Confocal fluorescence images of embryos in wild type (A, C, E) and rnst-2(qx245) (B, D, F) expressing VIT-2::GFP at different stages. (G–H’) DIC and confocal fluorescence images of the day three adult in wild type (G, G’) and rnst-2(qx245) (H, H’) expressing CAV-1::GFP. White arrowheads indicate spermatheca, yellow and blue arrowheads indicate oocytes and embryos, respectively. Scale bars: 5 µm. (I, J) Quantification of embryonic (I) and germ cell corpses (J) in wild type and rnst-2(qx245). At least 10 worms were scored in each strain and data are shown as mean ± SD. Two-way ANOVA with the Bonferroni post hoc test (I) or Student’s two-tailed unpaired t test (J) was performed to compare other datasets with wild type. All points had p>0.05.