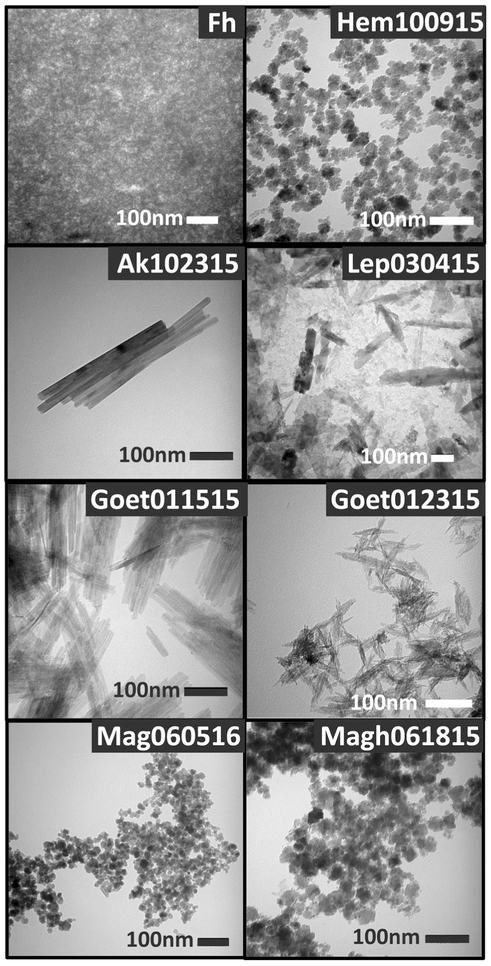
Fig. 2.
TEM of samples used in this study. Note the dramatic difference in crystallinity between the two goethite syntheses, despite quite similar sizes. The scale bar in all cases is 100 nm. Note that the particle sizing results were acquired over multiple frames for a total of 100 or more particles and these images may not reflect the full distribution

