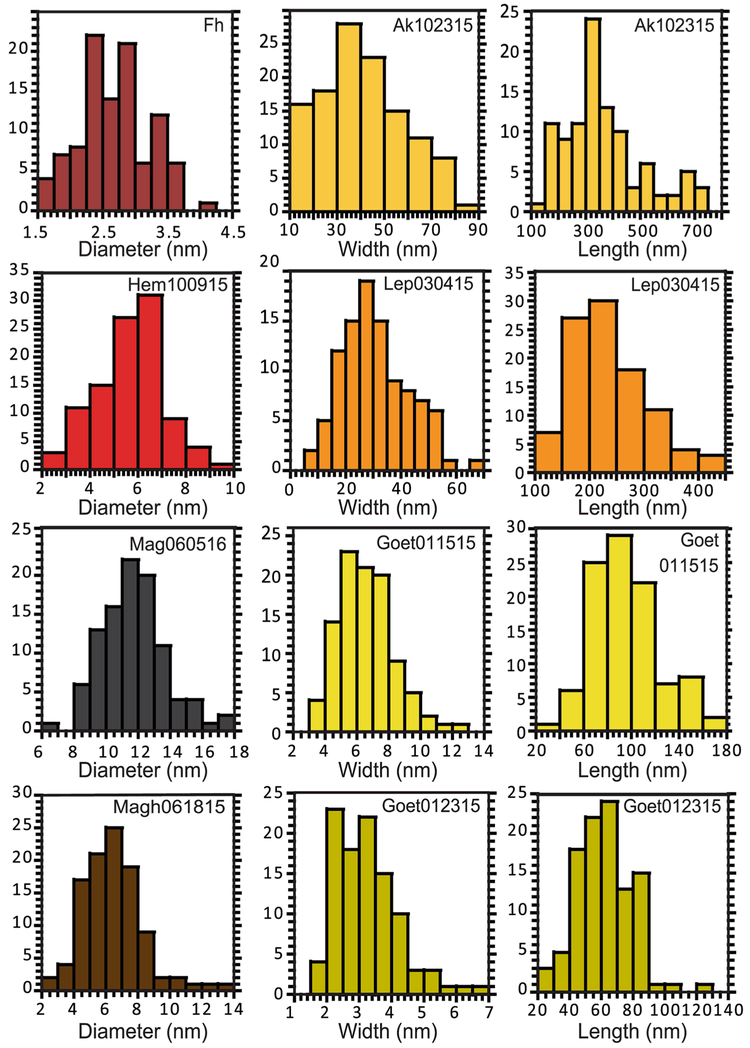
Fig. 3.
Particle sizing results for width/diameter and length of iron NPOs obtained from TEM analysis. The particle sizes are given for individual particles, although aggregates may be larger. Diameters of spherical samples are shown on the left, widths of acicular/tabular samples are shown in the center, and lengths of acicular/tabular samples are shown on the right

