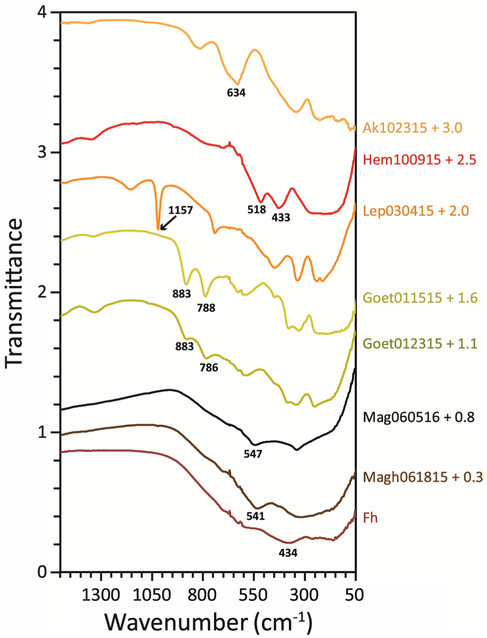
Fig. 5.
FTIR ATR spectra of nanophase iron oxides. Spectra are offset by amount indicated. MIR features used for identification (bold, underlined values in Table 3) are indicated on the plot. Note the overlapping peak positions for magnetite and maghemite

