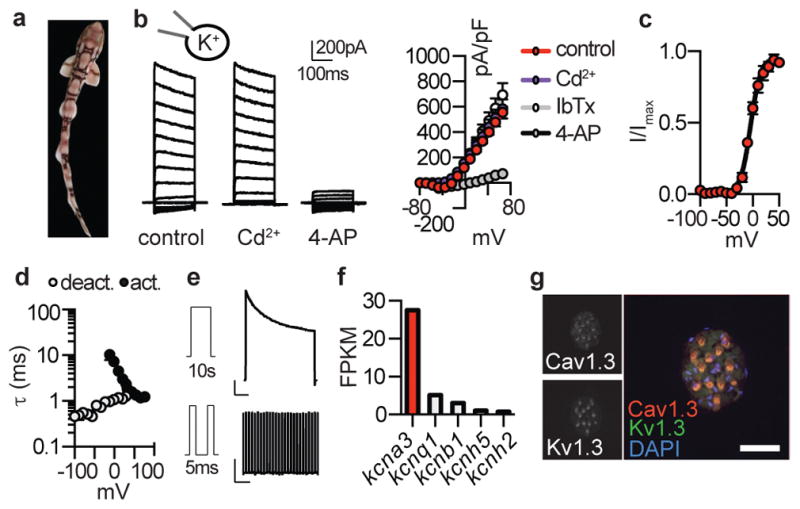
Figure 1. Major K+ current in shark electrosensory cells.

a. Profile of chain catshark (Scyliorhinus retifer).
b. Representative IKv currents elicited by increasing voltage pulses from −100mV were inhibited by the KV blocker 4-AP, but not the ICaV blocker Cd2+. Average I–V relationship from peak currents. n = 5, p < 0.0001 for outward control currents versus 4-AP, two-way ANOVA with post hoc Tukey test. The BK channel antagonist IbTx did not affect currents.
c. G–V relationships exhibited a half-maximal activation voltage (Va1/2) of −4.1 ± 0.8mV with a slope factor (Ka) of 9.5 ± 0.7mV. n = 11.
d. IKv activation and deactivation kinetics. τ values from single exponential fits of activation in response to the indicated voltage pulses (10mV increments from −100mV) or deactivation at the indicated voltages following an activating prepulse of 40mV. n = 6.
e. IKv inactivation over a 10s 40mV pulse (Top, 57 ± 4% current remained) and cumulative inactivation properties in response to repetitive 40mV pulses delivered in 5ms intervals (Bottom, 99 ± 2% current remained). Scale bars (Top) 500pA, 1s (Bottom) 500pA, 500ms. n = 8.
f. Voltage-gated K+ channel α-subunit mRNA expression in shark ampullary organs.
g. Co-localization of CaV1.3 (red) and KV1.3 (green) transcripts within catshark ampullary organs. Nuclei were stained with DAPI (blue). Scale bar, 100μm. Representative of n = 4.
All data represented as mean ± s.e.m.
