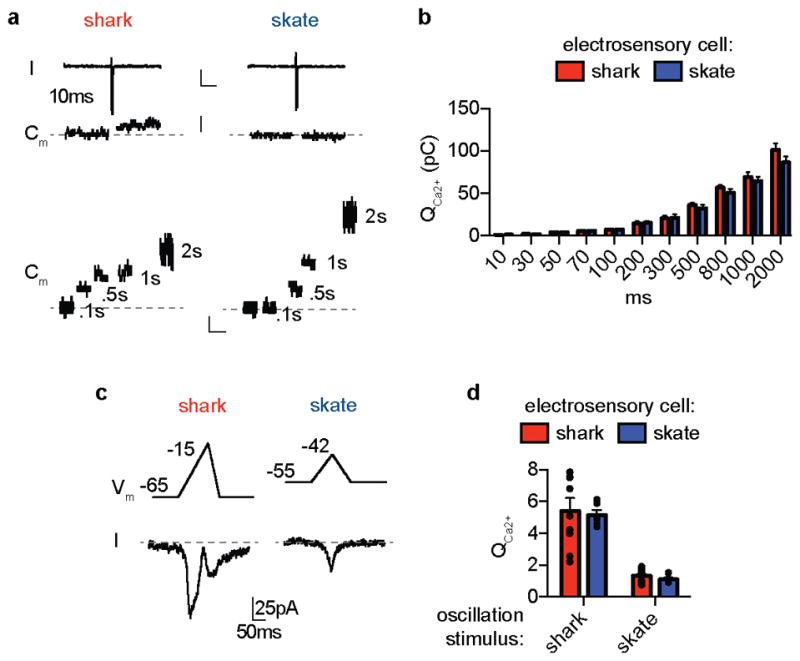
Extended Data Figure 9. Shark electrosensory cell vesicular release characteristics.

a. (Top) Currents and capacitance changes in response to a 10ms −20mV voltage pulse in shark and skate electrosensory cells. Scale bars, 50pA, 200ms. (Bottom) Representative capacitance changes in response to the indicated durations of a −20mV voltage stimulus. Scale bars, 25fF, 200ms.
b. −20mV voltage pulses of various durations induced similar integrated ICaV (QCa2+) in shark or skate electrosensory cells. n = 6.
c. ICaV elicited by simulated voltage spikes in shark electrosensory cells and smaller voltage oscillations in skate cells. K+ currents were blocked by intracellular Cs+, extracellular 4-AP and IbTx.
d. Voltage-clamp protocols made to simulate shark electrosensory cell spiking induced the same amount of QCa2+ in shark or skate cells. Similarly, voltage protocols that simulated smaller skate electrosensory cell voltage oscillations induced the same amount of QCa2+ in shark or skate cells. QCa2+ elicited by simulated voltage spikes was larger than QCa2+ elicited by simulated oscillations. n = 10 for shark and 5 for skate.
All data represented as mean ± s.e.m.
