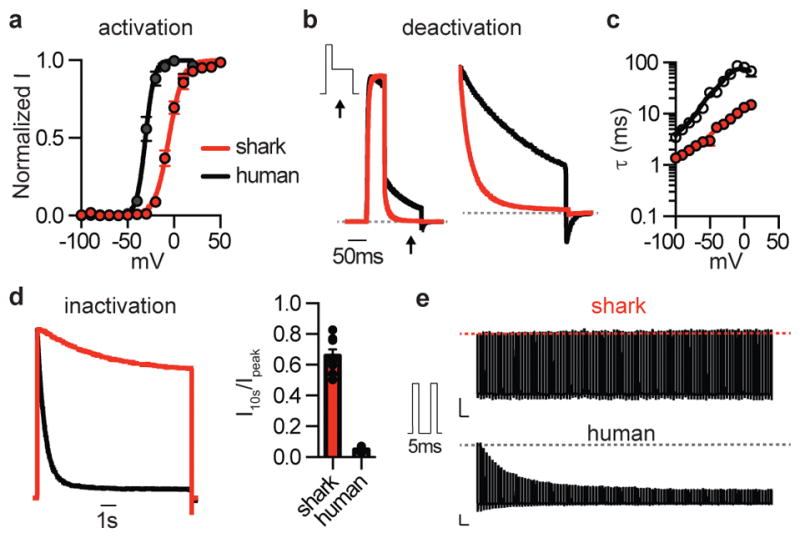
Figure 2. Shark KV properties.

a. Average G–V relationships from currents measured at −30mV following activating pulses at the indicated voltage. Shark KV1.3 Va1/2 was −5.4 ± 0.4mV, Ka = 7.6 ± 0.4mV, and human KV1.3 Va1/2 was −30.7 ± 0.5mV, Ka = 4.7 ± 0.5mV. n = 10, p < 0.0001 for Va1/2, two-tailed Student’s t-test.
b. Deactivation kinetics of KV currents at −30mV normalized to maximal amplitude elicited at 40mV. Arrows indicate when deactivation rates were measured. (Right) Expanded view.
c. Deactivation properties of shark (red) and human (black) KV1.3 channels. τ values from single exponential fits of deactivation at the indicated voltages following an activating prepulse of 40mV (Right). n = 6, p < 0.0001 for comparison of orthologues across voltage pulses, two-way ANOVA with post hoc Bonferroni test.
d. Normalized currents showing inactivation in response to a 10s 40mV pulse. Average current remaining at the end of 10s step. n = 8, p < 0.0001, two-tailed Student’s t-test.
e. Currents demonstrating differences in cumulative inactivation in shark (red) and human (black) KV1.3 channels in response to 40mV pulses from −100mV delivered in 5ms intervals. Representative of n = 12.
All data represented as mean ± s.e.m.
