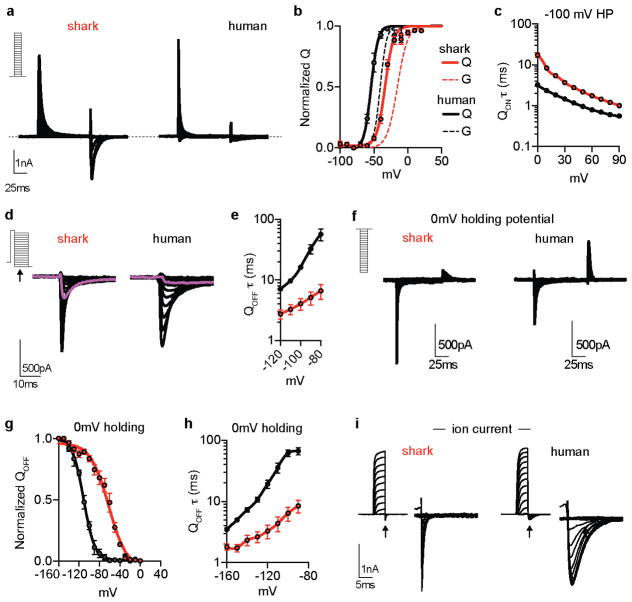
Extended Data Figure 5. Shark KV gating currents.
a. Gating currents recorded in HEK293 cells expressing nonconductive shark (red) or human (black) KV1.3 elicited by increasing voltage pulses in 10mV increments from a −100mV holding potential.
b. Average charge (Q)-V relationships. Shark KV1.3 Va1/2 was −33.4 ± 0.5mV, Ka = 6.1 ± 0.5mV and human KV1.3 Va1/2 was −54.25 ± 0.7mV, Ka = 5.2 ± 0.6mV. n = 9, p < 0.0001 for Va1/2 two-tailed Student’s t-test. Dotted lines indicate associated G–V relationships.
c. QON kinetics following voltage sensor activation from a holding potential of −100 mV were significantly slower in shark (red) compared with human (black). n = 7, p < 0.0001 for contribution of orthologue identity to series variance, two-way ANOVA with post hoc Bonferroni test.
d. Representative OFF gating current (QOFF) kinetics during repolarization in 10mV increments following a 40mV prepulse. Arrow indicates when deactivation rates were measured and purple traces show deactivation at −50 mV.
e. QOFF kinetics were significantly faster in shark (red) compared with human (black). n = 11, p < 0.0001 for contribution of orthologue identity to series variance, two-way ANOVA with post hoc Bonferroni test.
f. Gating currents recorded in HEK293 cells expressing nonconductive shark (red) or human (black) KV1.3 following decreasing voltage pulses in increments of 10mV from a holding potential of 0 mV. Scale bars, 500 pA, 25 ms.
g. Average charge (Q)-V relationships of downward voltage sensor movement (QOFF) in response to decreasing voltage pulses from a holding potential of 0 mV. Shark KV1.3 Va1/2 was −61.6 ± 1.9 mV and human KV1.3 Va1/2 was −110.9 ± 1.01 mV. n = 7, p < 0.0001 for contribution of orthologue identity to series variance, two-way ANOVA with post hoc Bonferroni test.
h. QOFF kinetics of voltage sensor deactivation from a holding potential of 0 mV were significantly faster in shark (red) compared with human (black). n = 7, p < 0.0001 for contribution of orthologue identity to series variance, two-way ANOVA with post hoc Bonferroni test.
All data represented as mean ± s.e.m.
i. Ion tail currents (indicating channel closure) deactivated faster in shark (red) compared with human (black) KV1.3. Tail currents were measured at −100mV following a series of activating voltage pulses that increased in 10mV increments. Inset: Arrows indicate when tail currents were measured following activating voltage pulses. Representative of n = 10. τ for deactivation from 60 mV pulse: shark = 1.5 ± 0.1ms, human = 5.5 ± 0.4ms. p < 0.0001, two-tailed Student’s t-test.

