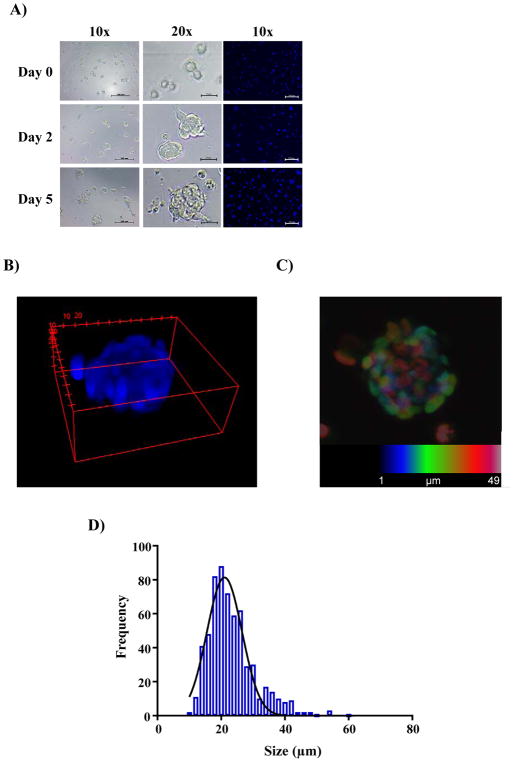
Figure 1.
Characterization of GSC spheroids in 1536-well format. (A) Representative images of 1536-wells seeded with 1000 GSCs cells at the indicated time points obtained by bright-field microscopy and confocal microscopy of live spheroids stained with Hoechst. Scale bars shown represent 100 microns for 10x magnification and 25 microns for 20x magnification images. (B) 3D representation generated by ImageJ from the Z-stack of 1 μm slices of a representative GSC-spheroid after growing for 2 days at 37°C and 5 % CO2. (C) Maximum intensity projection of the Z-stack analysis of a typical GSCs spheroid 2 days after seeding. Each slice is labeled with a different color in order to allow visual resolution of each layer when stacked. (D) Distribution of spheroids by size. Several wells (n = 4) were imaged and the size of every spheroid was calculated by ImageJ and the frequency of the different sizes is plotted.

