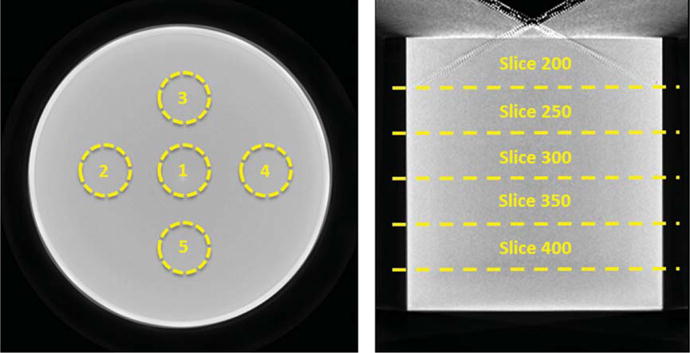
Fig. 3.

Reconstructed (LEFT) Coronal and (RIGHT) Sagittal slices of an example cylindrical phantom reconstruction, depicting the ROIs used to measure the average center to edge variation in HU values at 5 different locations in the cylinder (indicated by the slice numbers).
