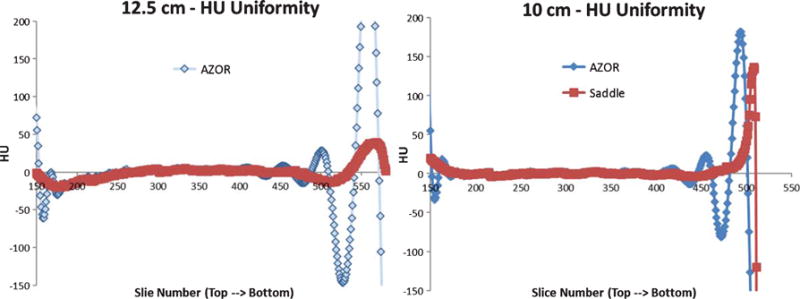
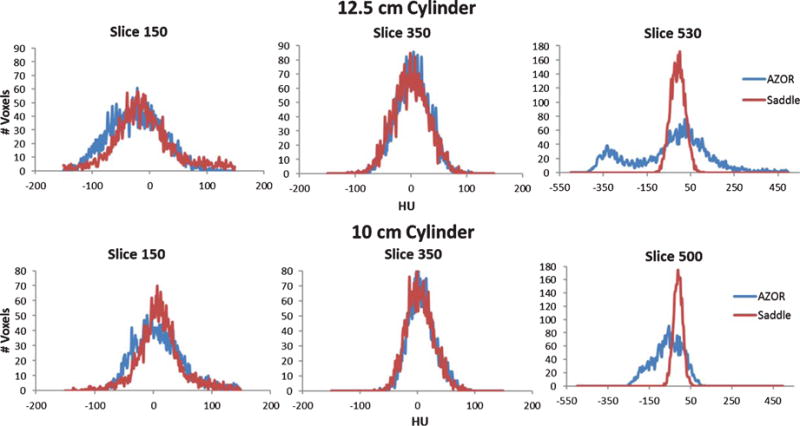
Fig. 7.


A. Plot of average HU measured in each slice, from the top to the bottom region of the cylinder, for the 12.5 and 10 cm diameter cylinders.
B. Histograms measured on coronal slices of the reconstructed (TOP) 12.5 cm and (BOTTOM) 10 cm cylinder volumes at three different locations: (LEFT) top -slice 150, (MIDDLE) mid – slice 350 and (RIGHT) bottom – slice 500/530. Note that the abscissa is wider (–550–500 HU) for the bottom slice to accommodate the large variation in AZOR reconstructed values.
