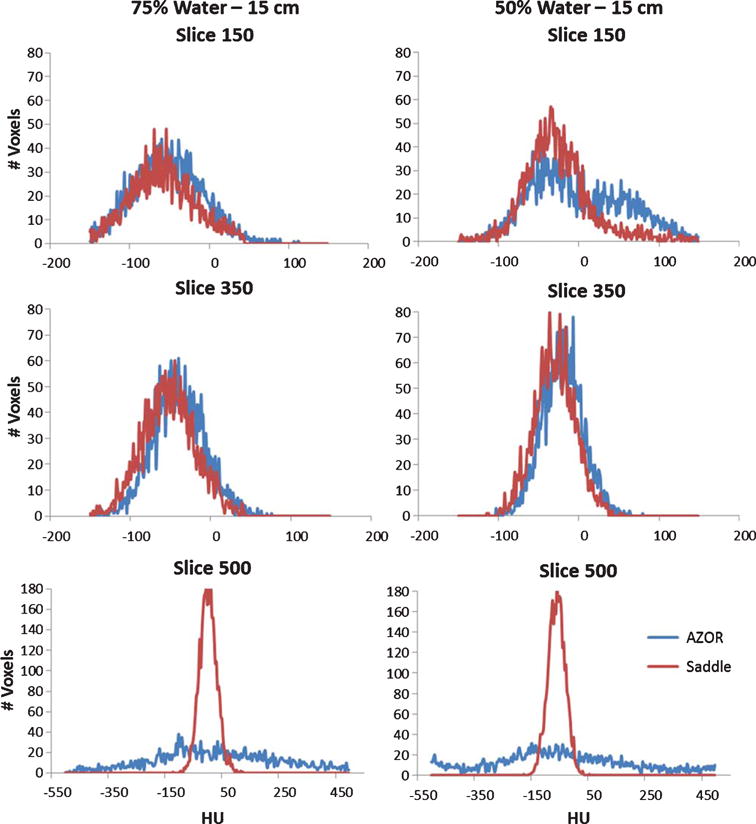
Fig. 9.

Histograms measured on coronal slices of the reconstructed 15 cm cylinder filled with (LEFT) 75% water and (RIGHT) 50% water. Measurements were made at three different locations: (TOP) top-slice 150, (MIDDLE) mid – slice 350 and (BOTTOM) bottom – slice 500. The HU value distribution within the slice is more uniform for the saddle case than the AZOR. Slice 500 measures the area affected by the shading artifact.
