
Figure 1.
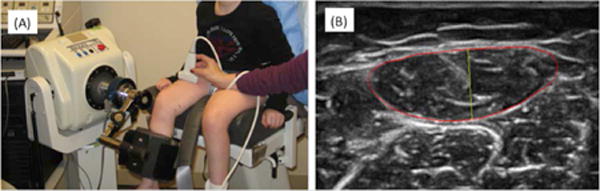
(A) Experimental setup for data acquisition. (B) Ultrasound image of the rectus femoris, with the muscle boundary outlined in red, and the thickness indicated in yellow.
Official websites use .gov
A
.gov website belongs to an official
government organization in the United States.
Secure .gov websites use HTTPS
A lock (
) or https:// means you've safely
connected to the .gov website. Share sensitive
information only on official, secure websites.
(A) Experimental setup for data acquisition. (B) Ultrasound image of the rectus femoris, with the muscle boundary outlined in red, and the thickness indicated in yellow.