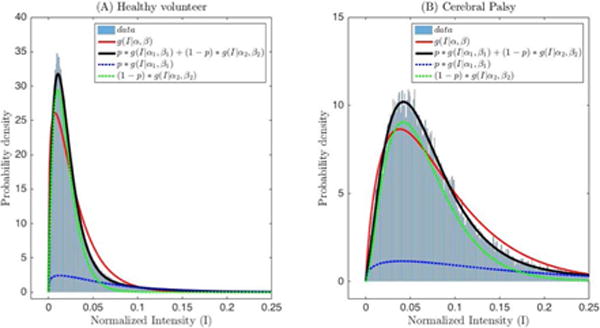
Figure 5.

(A) Histogram of backscattered ultrasound intensities in Figure 3(A) normalized by the maximum value, overlaid with the model fits for a single gamma (red, solid line) and mixture of two gamma distributions (black solid line). (B) Histogram of backscattered ultrasound intensities in Figure 3(C) normalized by the maximum value, overlaid with the model fits for a single gamma (red, solid line) and mixture of two gamma distributions (black, solid line). Blue and green dashed lines show the partial contribution of the two gamma distributions weighted by p and (1-p), respectively. g(I|α,β) is the probability density function of the gamma distribution.
