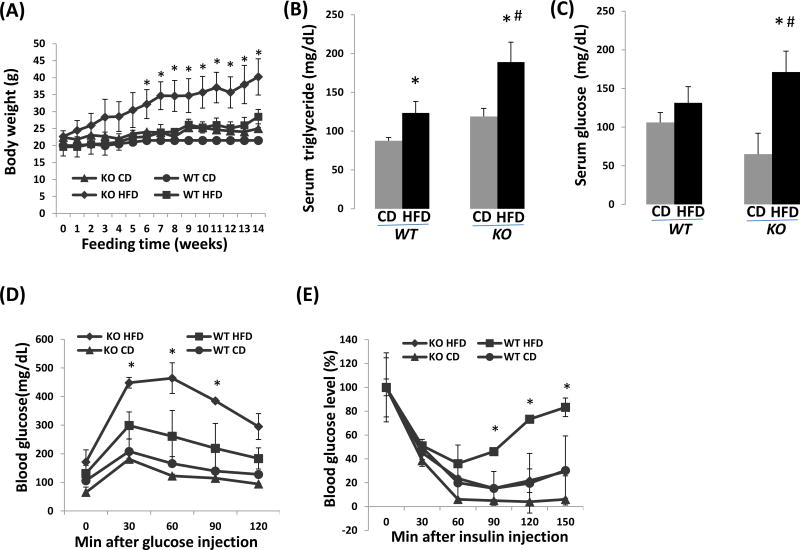
Figure 1.
HFD-induced obesity is more severe in cyp2a5−/− mice than in cyp2a5+/+ mice. (A) Body weight. *P<0.05, compared with WT HFD group. (B) Serum triglyceride. *P<0.05, compared with CD group; #P<0.05, compared with WT HFD group. (C) Serum glucose. *P<0.05, compared with CD group; #P<0.05, compared with WT HFD group. (D) Glucose tolerance test. * P<0.05, compared with WT HFD group. (E) Insulin tolerance test. * P<0.05, compared with WT HFD group. CD, control diet; HFD, high fat diet; KO, cyp2a5−/− mice; WT, cyp2a5+/+ mice.

